
Fig. 5.
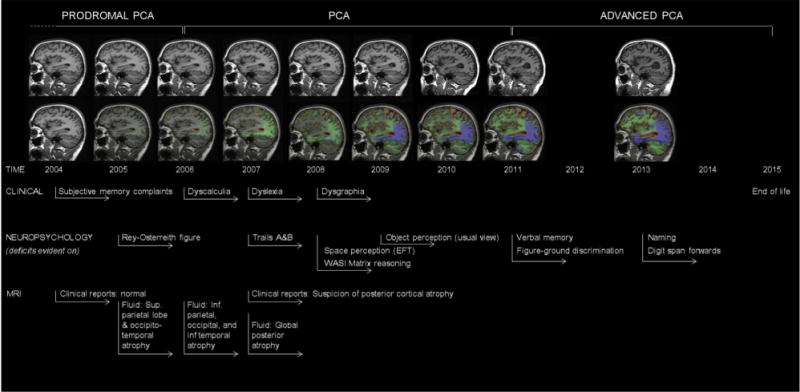
Longitudinal clinical, neuropsychological, and neuroimaging profile of an individual with pathologically proven PCA-AD showing example timelines for the provisional stages of prodromal PCA, PCA, and advanced PCA. Serial MR images (top row) show a sagittal view of the patient’s right hemisphere for all nine visits. Repeat scans were fluid-registered to the baseline image, and color-coded voxel-compression maps were produced (bottom row). The scale shows the percentage volume change per voxel (−20% to 20%) with green and blue representing contraction and yellow and red representing expansion. See Kennedy et al. [43] for a more detailed case description. Abbreviations: AD, Alzheimer’s disease; MR, magnetic resonance; PCA, posterior cortical atrophy.