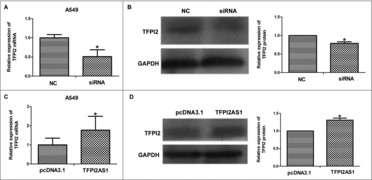
Figure 7.

TFPI2AS1 is positively associated with the expression level of TFPI2 in A549 cells. A549 cells were transfected with siRNA or pcDNA3.1/TFPI2AS1-full. TFPI2 mRNA level was measured by qRT-PCR assay (A and C). TFPI2 protein level was determined by Western blotting assay (B and D). GAPDH was regarded as endogenous normalize. *P < 0.05 vs control group. Data are expressed as the mean ± SD of the experiments performed in triplicate.
