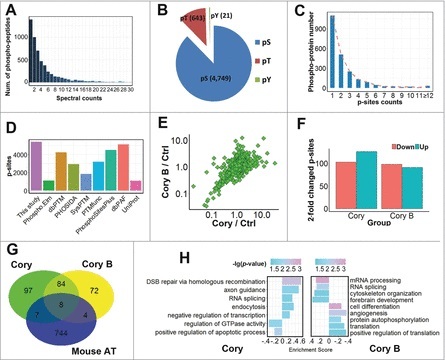
Figure 2.

A summary of the identified and quantified phosphoproteome and p-sites. (A) The distribution of MS/MS spectral counts (≤ 30) of phosphopeptides identified in this study. (B) The numbers of p-Ser, p-Thr and p-Tyr residues. (C) The number distribution of p-sites in quantified phosphoproteins. (D) The overlap of p-sites identified in this study compared with known p-sites in public databases. (E) The distribution of SILAC ratios for quantified p-sites in Cory- and Cory B-treated N2a cells against the control group. (F) The number of significantly upregulated (≥ 2-fold) or downregulated (≤ 0.5-fold) p-sites in the Cory or Cory B groups relative to the control. (G) The overlap of phosphoproteins with at least one ≥ 2-fold changed p-site against curated autophagy regulators in the THANATOS database.25 (H) The GO-based enrichment analysis of biologic processes that are differentially regulated by Cory (left) and Cory B (right) using GSEA (p-value < 0.05).
