
Figure 7.
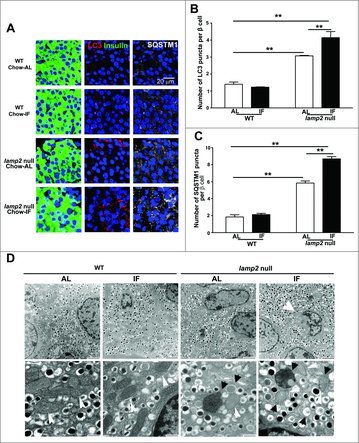
Intermittent fasting worsens autophagy impairment and provoke apoptosis in beta cells of lamp2 null male mice. (A) Representative images demonstrating expression of autophagy markers, LC3B and SQSTM1, in the islets from lamp2 null mice and wild-type controls fed a chow diet with ad-lib access to food or subjected to intermittent fasting for 6 wk (anti-insulin, green; anti-LC3B, red; anti-SQSTM1, gray). (B) Quantification of LC3B puncta from (A); n = 3 or 4 mice per group. (C) Quantification of SQSTM1 puncta from (A); n = 3 or 4 mice per group. (D) Representative electron micrographs of islets from mice treated as in (A). Top row demonstrates islet architecture. White arrow points to an apoptotic nucleus. Scale bar: 2 µm. Bottom row demonstrates organelle characteristics. Black arrows point to autophagic structures. White arrows point to mitochondria. Scale bar: 500 nm. **P < 0.001, ***P < 0.0001.