Figure 2.

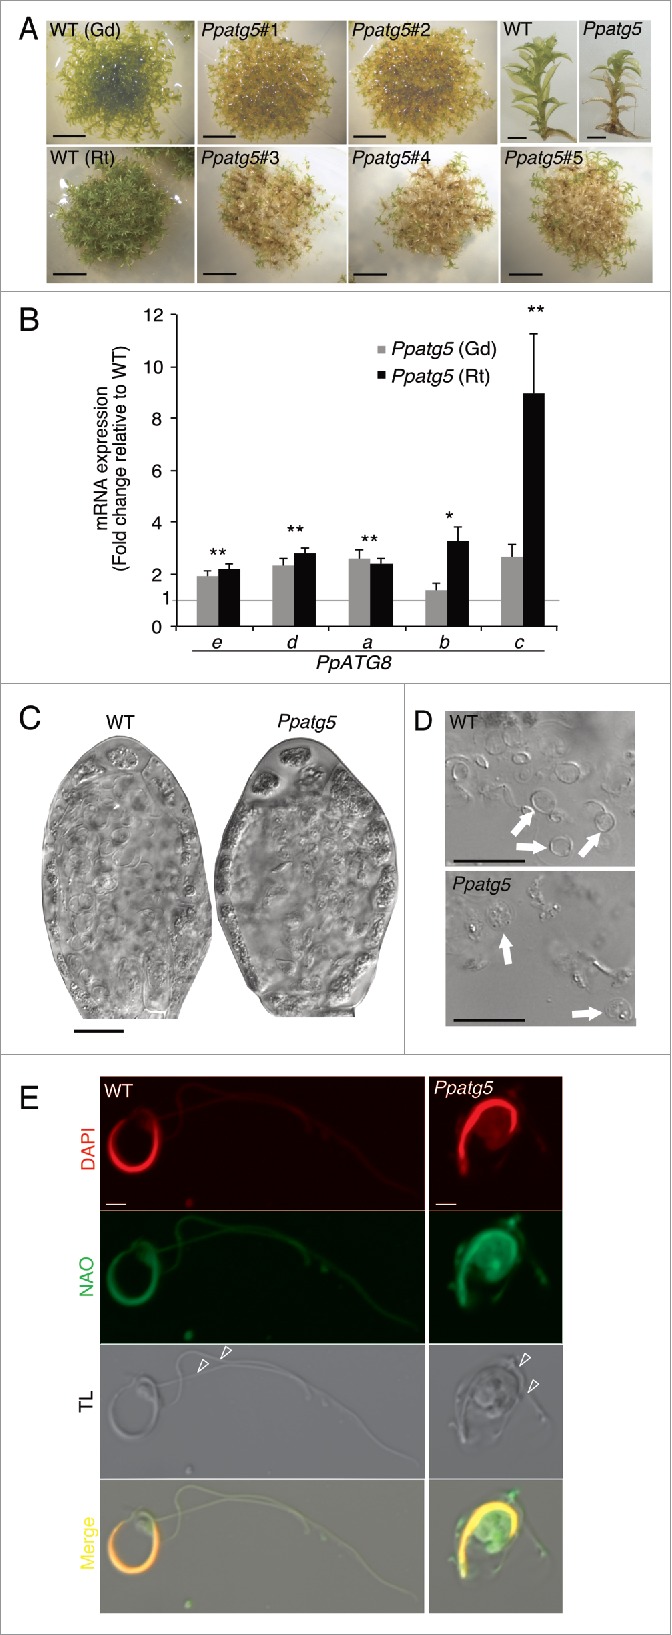
Ppatg5 lines show clear signs of blocked autophagy and morphologically defective sperm. (A) While 60-d-old gametophore producing WT colonies remain green and healthy, corresponding colonies of Ppatg5 KO lines have turned yellowish. Scale bar: 1 cm. Ppatg5 gametophore shoots show premature senescence in the basal leaves and stem-sections. Scale bar: 2 mm. (B) QRT-PCR analysis of the transcript levels of the different PpATG8 genes in the Ppatg5 lines compared with WT levels. Data are represented as mean of 3 biological replicates. **, statistically significant Student t test P< 0.05 for both ecotypes; * statistically significant Student t test P< 0.05 only for one ecotype. (C) Overview of representative antheridia at late stage of maturation, just before sperm release. (D) Mature sperm released from Ppatg5 antheridia appear malformed. (E) Mature sperm cells stained with DAPI and NAO. TL: Transmitted light. (C and D) are differential interference contrast micrographs, scale bar: 20 µm, (E) is confocal image, scale bar: 2 µm.
