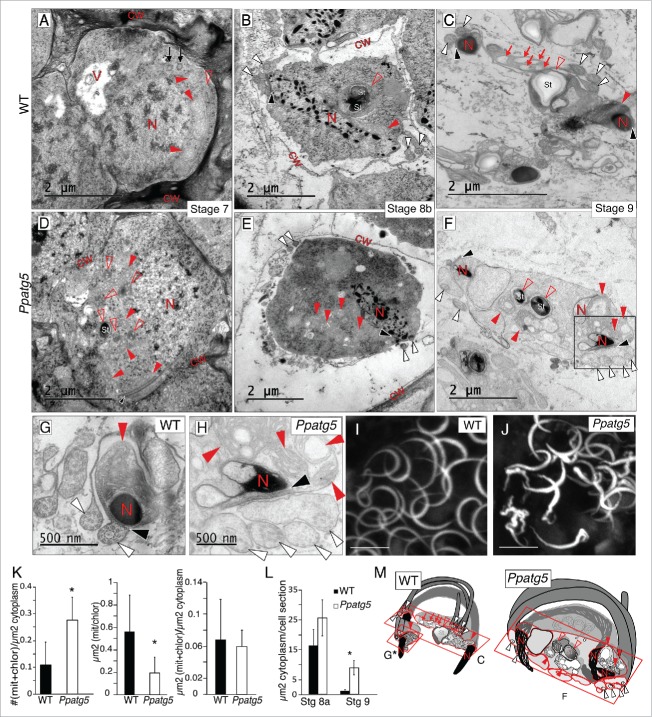
Figure 3.
Reduction of cytoplasm, organelle morphology, nuclei condensation and flagella structure are affected in Ppatg5 sperm. (A to H) TEM micrographs of representative WT and Ppatg5 spermatids at successive developmental stages and at similar plane sections. (G) Details of nuclei, flagella and anterior mitochondrion in WT and (H) Higher magnification of the boxed area in (F). (I and J) Maximum projection images from confocal microscopy of DAPI-stained sperm nuclei of WT and Ppatg5 respectively. Scale bar: 5 µm. (K) Quantification of the number of mitochondria and chloroplasts sections per µm2 of cytoplasm, error bar represents the SD for n = 10, statistically significant Student t test, * P< 0.001. Quantification of the area of independent mitochondria or chloroplast sections (µm2), error bar represents the SD for n = 21, statistically significant Student t test, * P< 0,001. Quantification of total µm2 of mitochondria + chloroplasts per µm2 of cytoplasm, error bar represents the SD for n = 10, Student t test showed no significant differences. All quantifications were made in spermatids of stage 8a antheridia. (L) Quantification of the cytoplasmic area per spermatid section at stages 8a and 9 of WT and Ppatg5. The area difference is most striking at stage 9. Error bar represents the SD for n = 10. Statistically significant Student t test, * P< 0.001. Measurements in (K and L) were performed with ImageJ. (M) Schematic representation of a mature sperm in WT and Ppatg5. The red squares show the plane of sections in micrographs (C), (F and G). V, vacuole; N, nucleus; cw, cell wall; St, starch granule; filled red arrowhead, mitochondrion; empty red arrowhead, plastid; white arrowheads, cross-section of flagella; red arrow, empty vesicle; black arrowhead, spline.

