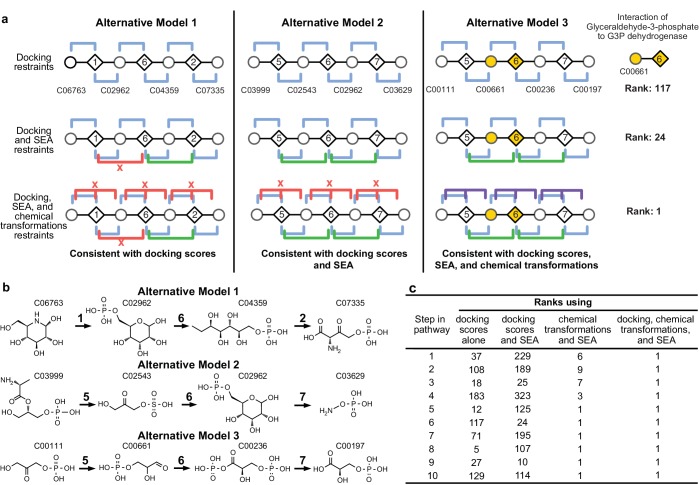
Figure 2. Representation of alternative models obtained based on consistency with input information provided for the glycolysis benchmark pathway.
(A) Example of three alternative models evaluated using different types of restraints based on modeling of the glycolysis pathway with a subset of pathways shown. The restraints on node patterns are shown using colored lines (blue – docking restraints, green – SEA restraints, purple – chemical transformation restraints, red – restraints with unfavorable scores). Metabolites are labeled by KEGG ID and enzymes are labeled by step in glycolysis pathway. On the left, alternate model one is consistent with docking scores, but not with all SEA scores and chemical transformations. In the middle, alternate model two is consistent with the docking scores and SEA scores, but not with chemical transformations. On the right, alternate model three is consistent with docking scores, SEA scores, and chemical transformations, thus increasing the rank of the correct enzyme-substrate pairings. (B) Alternative models shown with chemical structures. (C), Ranks of correct substrate for the corresponding enzyme at each step in the glycolysis benchmark case. 1 – glucokinase, 2 – phosphoglucose isomerase, 3 – phosphofructokinase, 4 – fructose bisphosphate aldolase, 5 – triosephosphate isomerase, 6 – glyceraldehyde 3-phosphate dehydrogenase, 7 – phosphoglycerate 8 – phosphoglycerate mutase 9 – enolase and 10 – pyruvate kinase.


