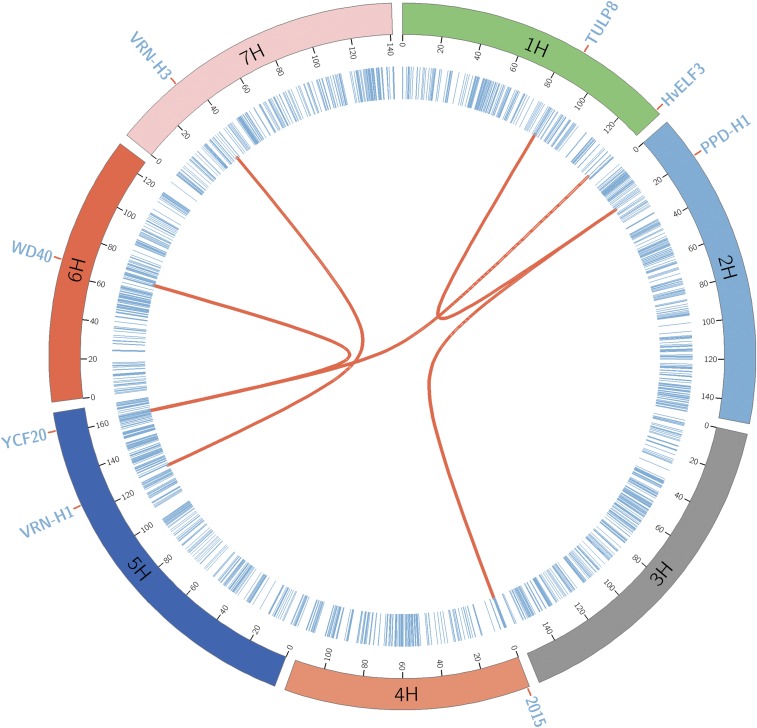
Figure 3.
Genetic map of the barley Multiparent Advanced Generation Inter-Cross population with the epistatic interactions. The chromosomes are shown with different colors and the markers in blue lines. The two-way-interacting QTL are connected with red lines and the candidate genes associated with the regions are also shown. Here, “2015” is the region reported by Maurer et al. (2015)

