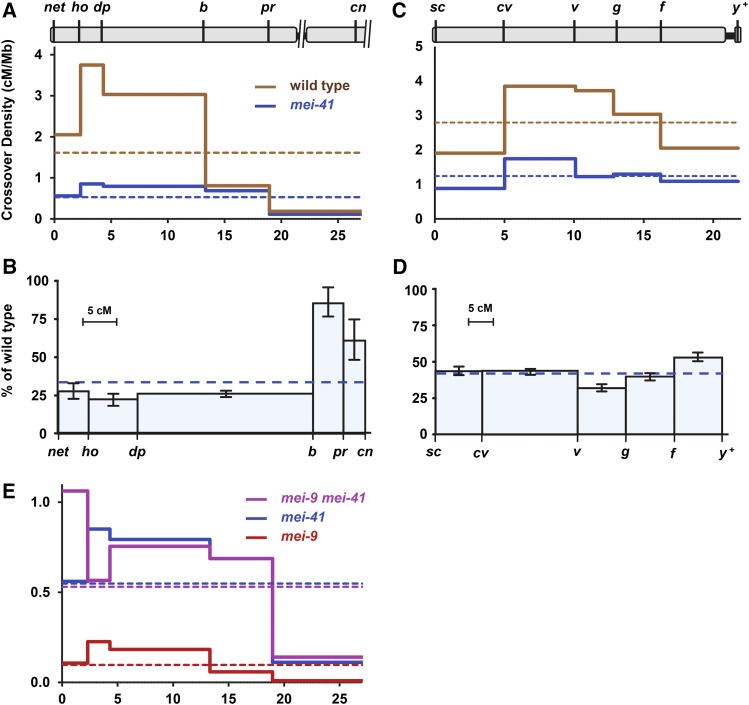
Figure 1.
Reduction of crossing over in mei-41 null mutants. (A and B) Crossover distribution on chromosomes 2L (A) and X (B) in mei-4129D mutants compared to wild type. Marker location indicated at top based on genome assembly position (megabase), excluding the centromere, unassembled pericentromeric satellite sequences, and transposable elements. Crossover density (solid lines) was determined for wild-type and mei-41 mutant females. Dotted lines show mean crossover density across the entire region. (C and D) Crossing over on chromosomes 2L (C) and X (D) in mei-4129D mutants as a percentage of wild type. The x-axis is scaled to genetic distance (centiMorgan) in wild-type females. Bars are 95% confidence intervals. (E) Crossover density in mei-9 and mei-41 single and double mutants. Note scale difference compared to (A). Wild-type chromosome 2L: n = 4222 progeny, 1943 crossovers. mei-41 chromosome 2L: n = 7801 progeny, 1175 crossovers. Wild-type X: n = 2179 progeny, 1367 crossovers. mei-41 X: n = 5174 progeny, 1396 crossovers. mei-9: n = 2433 progeny, 67 crossovers. mei-9mei-41: n = 1059 progeny, 165 crossovers. Wild-type and mei-9 single mutant data are from Hatkevich et al. (2017), used with permission. Full data sets are in Tables S1 and S2 in File S1. cM and cM/Mb, with 95% confidence intervals, are in Table S3 in File S1.

