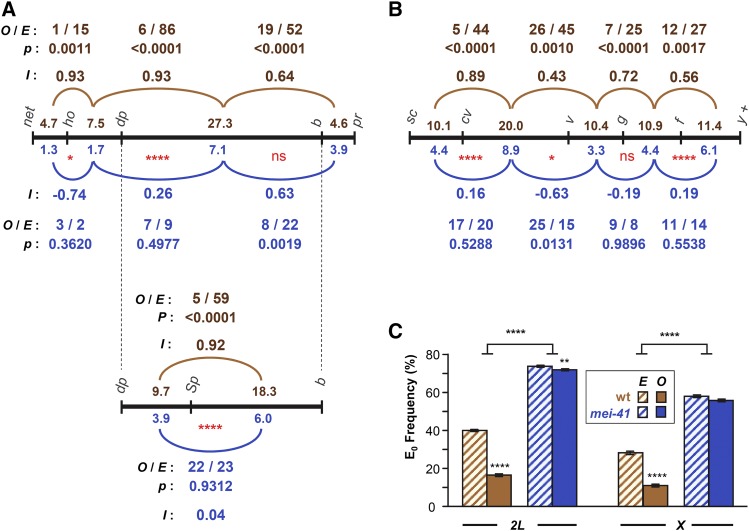
Figure 2.
Interference and assurance in mei-41 null mutants. (A) Interference on chromosome 2L. Black line represents genetic map of markers used, with size of each interval (in centiMorgan) listed above the line for wild-type females and below the line for mei-41 mutants. The pr–cn interval was omitted because it spans the centromere and because of low numbers of DCOs between this and the adjacent interval. Arcs represent pairs of adjacent intervals in which interference was assessed. Above (for wild type, brown) or below (mei-41, blue) each arc is listed the number of observed DCOs (O) and the number expected (E) if the two intervals are independent (no interference). P-values indicate the probability of observing these data under the null hypothesis, which is that the two intervals are independent (see Materials and Methods). Stevens’ interference (I), which equals 1 − (O/E), is also given. Red * below map lines are from Chi-squared analysis comparing O and E between wild type and mutant (see Materials and Methods). In a separate experiment, the large dp–b interval was further divided by the addition of Sp (wgSp-1). (B) Similar analysis of interference on the X chromosome. The f–y+ region spans the centromere, but since the marker on the right arm (y+) is hemizygous (i.e., a duplication of the tip of chromosome XL onto XR on one homolog), all crossovers must be to the left of the centromere. (C) Crossover assurance assessed by comparing frequencies of E0 bivalents. Expected E0 frequency is based on Poisson distribution from the average number of crossovers per meiosis; observed frequencies were calculated using the method of Weinstein (1936). Statistical significance between expected and observed E0 frequencies determined via Chi-square tests. Bars show 95% confidence intervals. Sample sizes for chromosomes 2L and X are given in Figure 1. For the dp–Sp–b experiment, n = 3325 flies, 928 crossovers for wild-type; n = 9740 flies, 972 crossovers for mutants. P-values reported were not corrected for multiple comparisons. Nonsignificance (ns) is for P > 0.05. * P < 0.05, ** P < 0.01, **** P < 0.0001.

