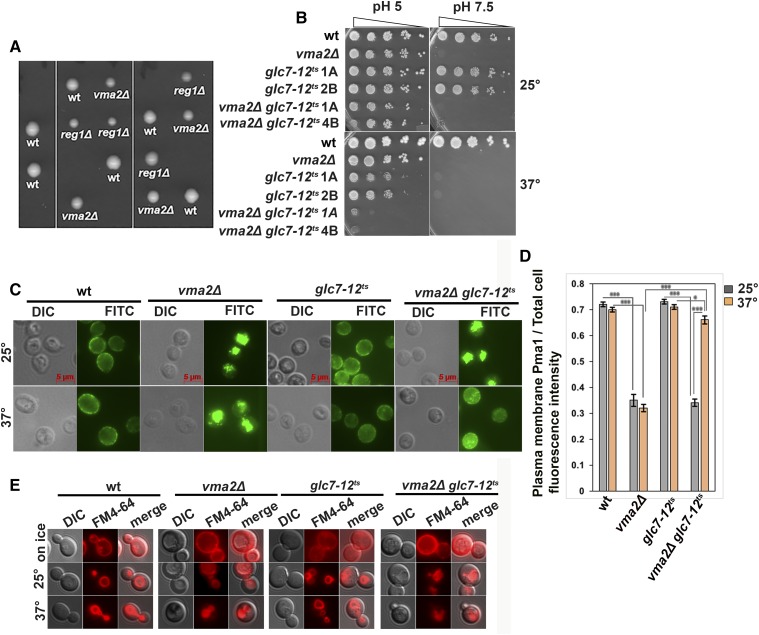
Figure 2.
Protein phosphatase type 1 (PP1) is required for the growth of the yeast lacking functional V-ATPases and is required for the internalization of Pma1. (A) The tetrads obtained by crossing a PP1 regulatory subunit mutant, BY4741 reg1Δ::kan, with vma mutant y3536vma2Δ::nat cells. (B) Dilution growth assay comparing the growth of a glc7-12ts vma2Δ double mutant (two double mutants from two different tetrads are shown) with the corresponding glc7-12ts single mutant (two single mutants from two different tetrads are shown), vma2Δ cells, and wild-type (wt) cells at permissive temperature of 25° to that of at the nonpermissive temperature of 37°. The double mutant was obtained by tetrad dissection at 25° by crossing a temperature-sensitive PP1 catalytic subunit mutant, glc7-12ts:: kan, with a vma mutant, y3536 vma2Δ::nat. The vma phenotype is verified by checking the growth at YPD pH 7.5 as the vma mutant phenotype is conditionally lethal at higher pH. (C) Anti-Pma1 indirect immunofluorescence (see Materials and Methods) image of fixed cells comparing the localization of Pma1 in the glc7-12tsvma2Δ double mutant with the corresponding glc7-12ts single mutant, vma2Δ cells, and the wt cells. The glc7-12tsvma2Δ double-mutant cells and the glc7-12ts single-mutant cells were initially grown to the log phase in YPD pH 5 at the permissive temperature of 25°; then, to inhibit the PP1 catalytic subunit Glc7, these mutants were shifted to the nonpermissive temperature of 37° for 2 hr. A representative of three independent experiments is shown. (D) Bar graph showing the plasma membrane (PM) Pma1 fluorescence intensity as a fraction of total cell fluorescence intensity (arbitrary units) in different cells in (C). From each strain, 52 cells were quantified for the fluorescent intensity of Pma1 at the PM as a measure of the amount of Pma1 retaining at the PM, as described in the Materials and Methods. The P-value ≤ 0.05 is considered significant. In the bar graph, * P < 0.05 and *** P < 0.0005. P > 0.05 is considered nonsignificant and nonsignificant differences are not indicated in the bar graph. The error bars indicate ± SEM. (E) Micrograph showing the uptake of FM 4-64 dye in wt, vma2Δ, glc7-12ts, and vma2Δ glc7-12ts cells. Cells were initially labeled on ice to mark only the PMs and immediately imaged using a Texas Red filter. Later, cells were chased for 2 hr at either 25 or 37°, as described in the Materials and Methods, and imaged using Texas a Red filter to monitor the uptake of FM 4-64 from the PM to the vacuole.

