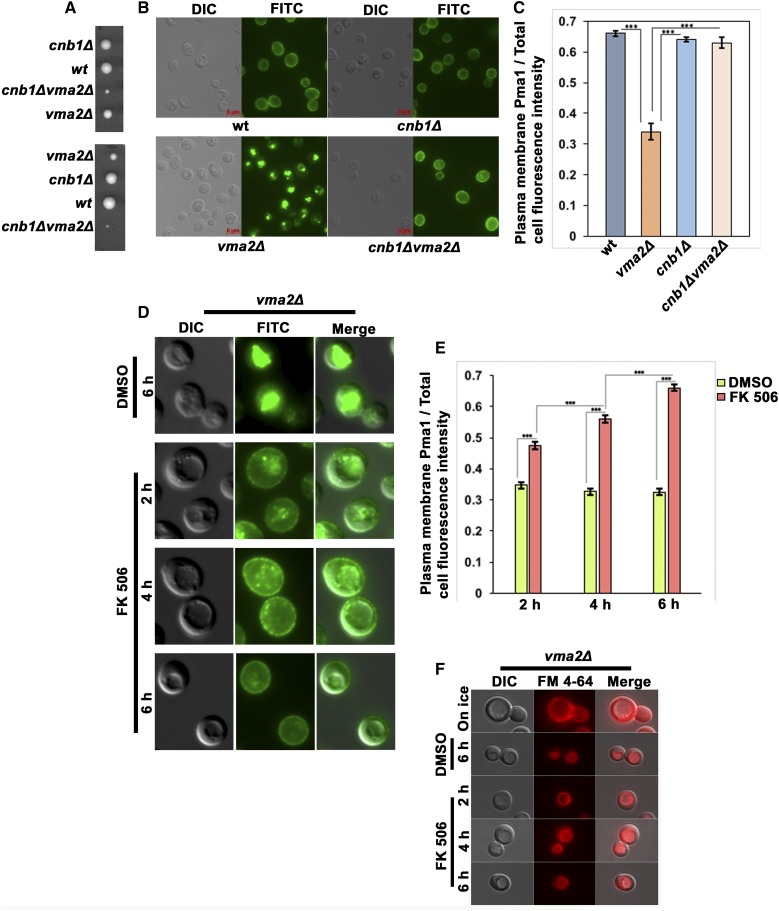
Figure 4.
Calcineurin is required for the internalization of Pma1 in the yeast cells lacking functional V-ATPases. (A) Two tetrads obtained from the cross of a calcineurin mutant, BY 4742 cnb1Δ::nat, with a vma mutant, BY 4741vma2Δ::kan. The cnb1Δvma2Δ double mutant grows very poorly compared to the single mutants. (B) Anti-Pma1 indirect immunofluorescence from the spores in a tetrad shown in (A). The cells were allowed to grow in YEP dextrose medium pH 5 to the log phase, and were then fixed as described in the Materials and Methods to monitor the localization of Pma1. (C) Bar graph showing the plasma membrane Pma1 fluorescence intensity as a fraction of total cell fluorescence intensity (arbitrary units) in different cells in (B). From each strain, 52 cells were quantified for the fluorescent intensity of Pma1 at the plasma membrane as a measure of the amount of Pma1 retaining at the plasma membrane, as described in the Materials and Methods. The P-value ≤ 0.05 was considered significant. In the bar graph, *** P < 0.0005. P > 0.05 was considered nonsignificant and nonsignificant differences were not indicated in the bar graph. The error bars indicate ± SEM. (D) The vma2Δ cells were treated with either DMSO or with 10 μg/ml of a calcineurin inhibitor, FK506. The cells were collected 2, 4, and 6 hr after treatment and fixed to observe the Pma1 localization using anti-Pma1 indirect immunofluorescence. In the DMSO-treated cells, only the 6 hr time point is shown. A representative of three different experiments is shown. (E) Bar graph showing the plasma membrane Pma1 fluorescence intensity as a fraction of total cell fluorescence intensity (arbitrary units) from cells in (D). From each condition, 52 cells were quantified for the fluorescent intensity of Pma1 at the plasma membrane as a measure of the amount of Pma1 retaining at the plasma membrane, as described in the Materials and Methods. The P-value ≤ 0.05 was considered significant. In the bar graph, *** P < 0.0005. P > 0.05 was considered nonsignificant and nonsignificant differences are not indicated in the bar graph. The error bars indicate ± SEM. (F) Micrograph showing the uptake of FM 4-64 dye in vma2Δ cells treated with either DMSO or the calcineurin inhibitor FK506. Cells were initially labeled on ice to mark only the plasma membranes and immediately imaged using a Texas Red filter. Later, cells were chased at 30° for 2, 4, and 6 hr in the presence of either DMSO or the calcineurin inhibitor FK506, as described in the Materials and Methods, and imaged using a Texas Red filter to monitor the uptake of FM 4-64 from the plasma membrane to the vacuole. wt, wild-type.

