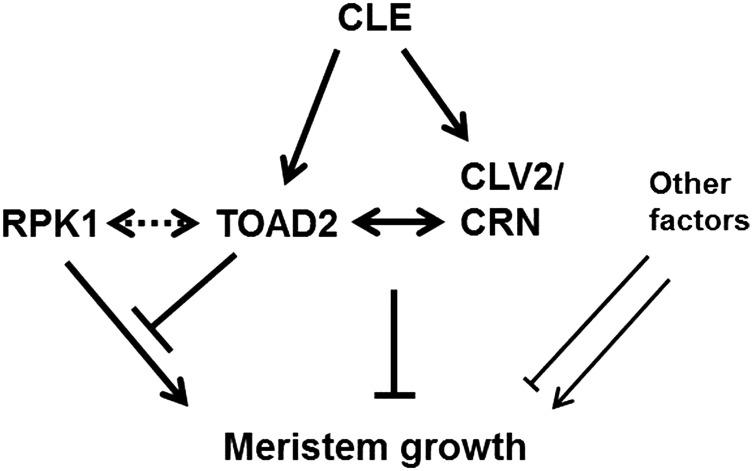
Figure 11.
Model for RPK1 and TOAD2 interactions in controlling root growth. Diagram shows a proposed model of a regulatory network controlling root meristem growth by TOAD2, RPK1, CLV2, CRN, and other unknown components. Dotted double arrows indicate potential direct interaction, solid double arrows indicate known interactions. Arrows symbolize positive regulation and bars indicate negative regulation. Unknown components could have both positive and negative regulatory roles.

