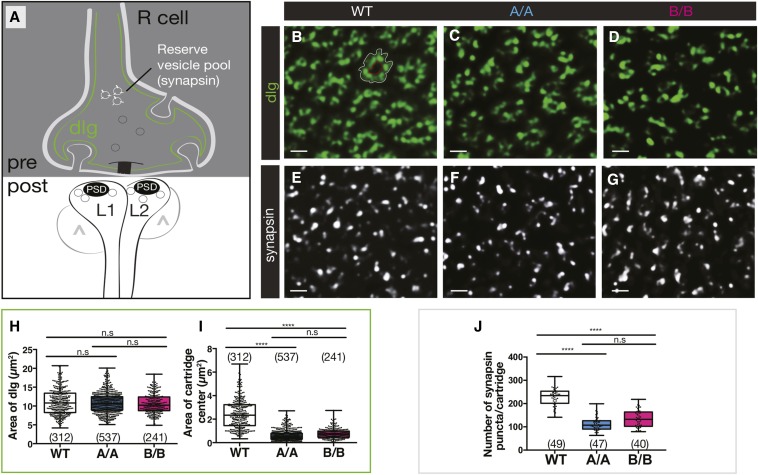
Figure 1.
Dscam2 single-isoform mutants have a reduction in presynaptic markers and reduced lamina cartridge size. (A) Schematic representation of an R cell tetrad synapse showing localization of dlg (green) and synapsin (white) on the presynaptic membrane. The postsynaptic side of the synapse includes L1-expressing Dscam2B, L2-expressing Dscam2A, and amacrine/L3/glial cells (^) that represent the variable components of the postsynaptic complex. PSD, postsynaptic density. (B–G) Representative deconvolved optical cross-sections of lamina cartridges from wild-type (WT), Dscam2A (A/A), and Dscam2B (B/B) single-isoform lines. (B–D) dlg labeling (green) and (E–G) anti-synapsin (white). (H and I) Quantification of anti-dlg-labeled area (between white outline and red outline) (H) and the center region of each cartridge devoid of labeling (within red outline) (I). (J) Quantification of synapsin puncta per lamina cartridge using “spot tool” in Imaris. As the cartridge is difficult to define with synapsin labeling alone, costaining with synaptotagmin 4 (see Figure 2) was performed to demarcate cartridges. Boxplot format: middle line = median, range bars = min and max, box = 25–75% quartiles, and each data point = single cartridge. Cartridge number for each genotype is shown in parentheses. Kruskal–Wallis test with Dunn’s multiple comparison test. n.s (not significant) P > 0.05 and **** P < 0.0001. Bar, 2 μm.

