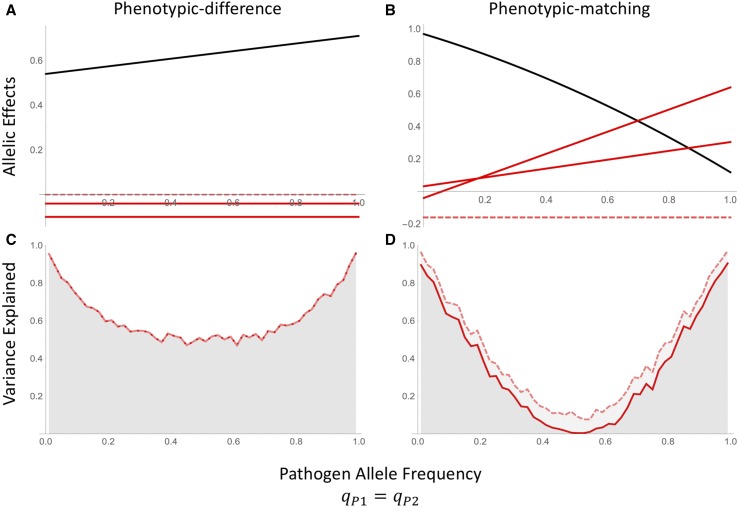
Figure 2.
Host-only model with resistance dependent on phenotypic differences (A,C) or phenotypic matching (B,D) between hosts and parasites. (A and B) Allelic effects inferred using the host-only design from Equation 6: (black), and (solid red lines), (dashed red). (C and D) Variation explained by host additive effects only (solid line), and host additive and epistatic effects (dashed line) as given by the host-only model in (6).

