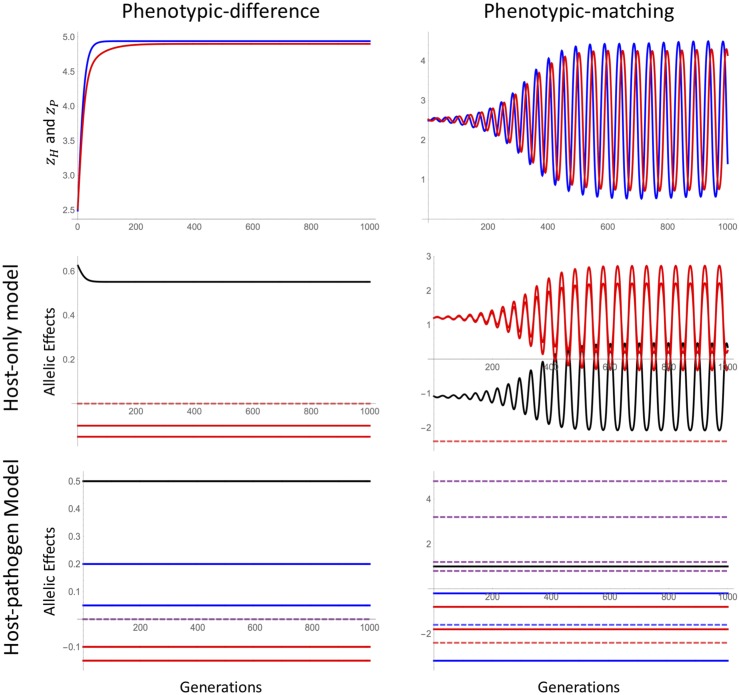
Figure 4.
Allelic effects over coevolutionary time. Top row: Phenotypes (red) and (blue) simulated over coevolutionary time in the phenotypic-difference (left) and phenotypic-matching models (right). Middle row: Coefficients estimated under the host-only model (7) (black is solid red is dashed red is ). Bottom row: Coefficients estimated under the host–pathogen model (9) (black is solid red is dashed red is blue is dashed blue is purple dashed is ). Because epistatic and G × G interactions are absent in the phenotypic-difference model, their allelic effects all overlap at 0 and hence are not all visible.

