FIGURE 5.2.

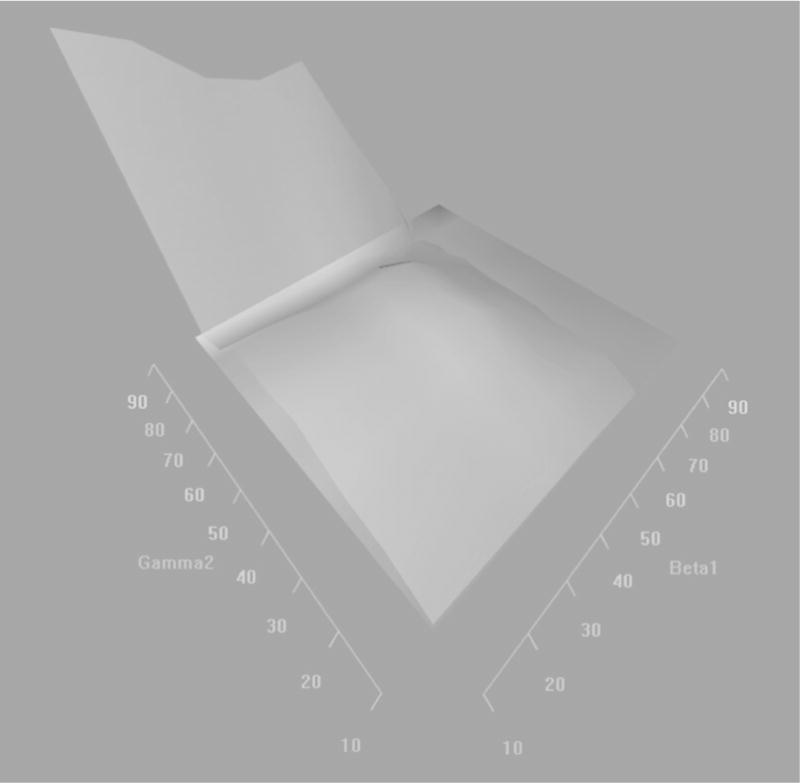
3-D plot representing the indirect effects of standardized particle number on the qth percentiles of the standardized fibrinogen distribution through a change in the pth percentiles of the standardized IFN-y methylation distribution

3-D plot representing the indirect effects of standardized particle number on the qth percentiles of the standardized fibrinogen distribution through a change in the pth percentiles of the standardized IFN-y methylation distribution