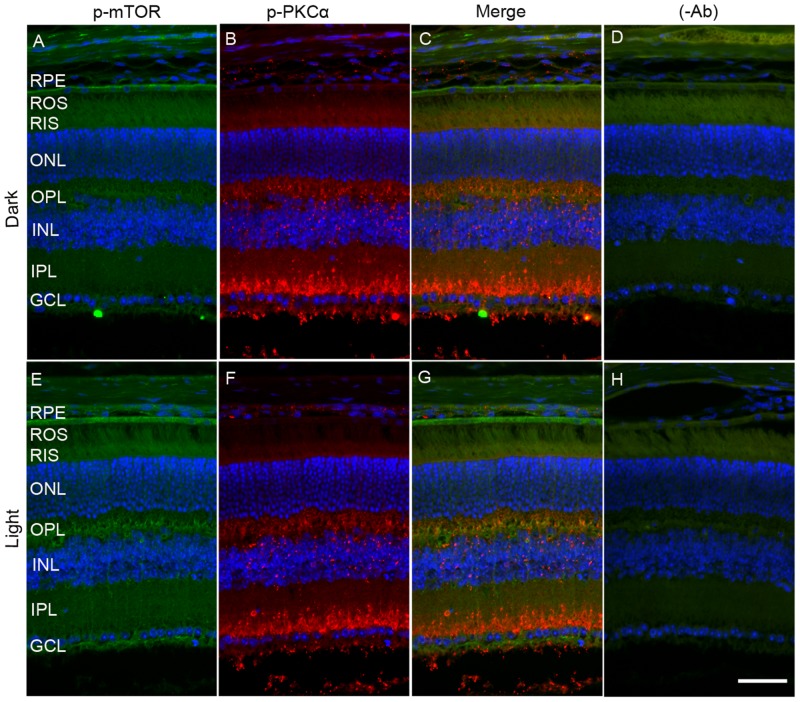
Figure 8. Immunofluorescence analysis of PKCα and mTOR in dark- and light-adapted mouse retina.
Prefer-fixed sections of dark- A.-D. and light-adapted E.-H. mouse retinas were stained for p-mTOR (green A, E), p-PKCα (red, B, F), and DAPI (A-H). Panels C and G represent the merged images of p-PKCα and p-mTOR, whereas panels D and H represent the omission of primary antibodies. ROS, rod outer segments; RIS, rod inner segments; ONL, outer nuclear layer; OPL, outer plexiform layer; INL, inner nuclear layer; IPL, inner plexiform layer; GCL, ganglion cell layer. Scale bar = 50 μm.

