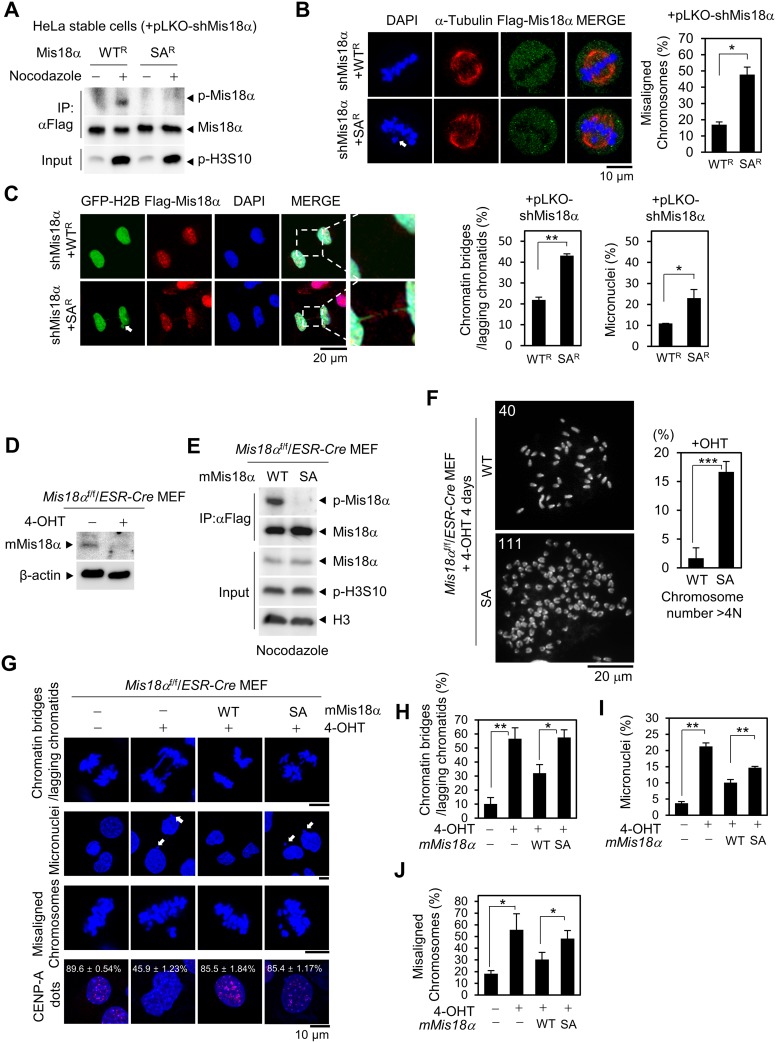
Figure 2. Mis18α phosphorylation is necessary for faithful mitotic division.
(A) Immunoblotting for Mis18α phosphorylation in nocodazole-synchronized HeLa/Flag-Mis18α stable cells. WTR or SAR represents shRNA-resistant form of Mis18α proteins. (B) Images of misaligned chromosomes in HeLa/Flag-Mis18α stable cells (left) and the number of cells showing misaligned chromosomes presented in percentage (right). P value is calculated by t-test (*p < 0.05). (C) Images of the chromatin bridges or lagging chromatids and micronuclei in HeLa/Flag-Mis18α stable cells (left) and the number of cells showing the chromatin bridges or lagging chromatids presented in percentage (right). P value is calculated by t-test (*p < 0.05). (D) Mis18αf/f/ESR-Cre MEFs were treated with 4-hydroxy-tamoxifen (4-OHT) for four days and the depletion of endogenous mMis18α was validated by immunoblot using anti-mMis18α antibody. (E) The phosphorylation of mMis18α proteins in Mis18αf/f/ESR-Cre MEFs reconstituted with Flag-mMis18α WT or Flag-mMis18α SA were validated by immunoblotting with anti-p-Mis18α antibody. (F) Reconstituted Mis18αf/f/ESR-Cre MEFs were analyzed by chromosome spreading assay. Histogram in right side shows the percentage of cells containing chromosome number over 4 N for each genotype. The number of chromosome spreads is 120 each and chromosomes were counted using Image J software by identifying the centromeres, the brighter part than the rest of the chromosome. P value is calculated by t-test (***p < 0.001). (G) The chromatin bridges or lagging chromatids, micronuclei and misaligned chromosomes were analyzed in reconstituted Mis18αf/f/ESR-Cre MEFs in parallel with CENP-A dots. (H–J) The percentage of cells showing the chromatin bridges or lagging chromatids (H), micronuclei (I), and misaligned chromosomes (J) was calculated from the images in G. P value is calculated by t-test (*p < 0.05, **p < 0.01).

