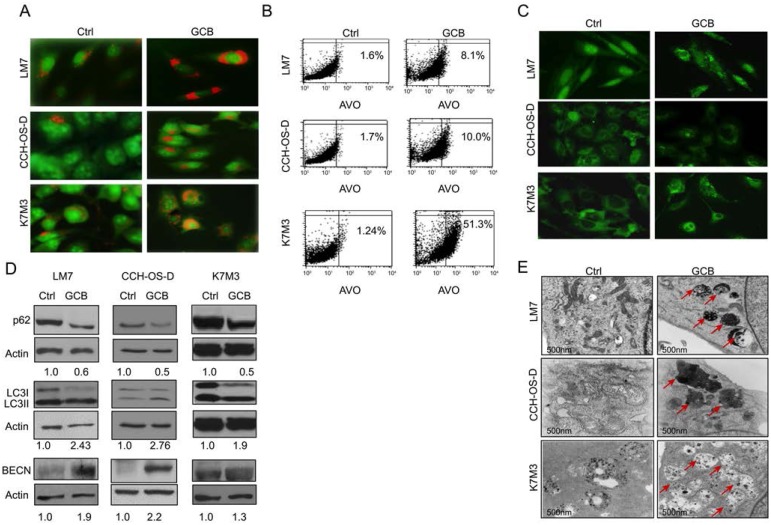
Figure 2. Treatment with gemcitabine (GCB) induces autophagy in osteosarcoma cells.
A. Following 48 hours of treatment with 1μM GCB, LM7, CCH-OS-D, and K7M3 cells were stained with the lysosomotropic agent acridine orange (1 μg/ml) for 15 minutes and then visualized under a confocal microscope. Treatment with GCB led to the formation of acidic vesicular organelles (AVOs –red/orange), as shown in the representative images. B. Flow cytometry was used to measure and quantify AVO formation in untreated (left) and treated (right) osteosarcoma cells. C. Cells were treated with 1μM GCB for 48 hours, and after fixation, cells were stained with anti-LC3 antibody and analyzed by fluorescence confocal microscopy. GCB increases the number of green punctae in the treated group as compared to the untreated. D. Expression of BECN, LC3, and p62 was analyzed using Western blot analysis. Cells were treated with GCB for 48 hours, lysed and extracted protein was analyzed using specific antibodies. β-actin was used as a loading control. Autophagy induction is demonstrated by an increase in the conversion of LC3I to LC3II, BECN expression and a decrease in p62 expression in the treated group as compared with the untreated. E. Treatment of OS cells with GCB (1μM, 48 hours), led to an increase in the formation of autophagic vacuoles (shown with red arrows) measured by transmission electron microscopy.

