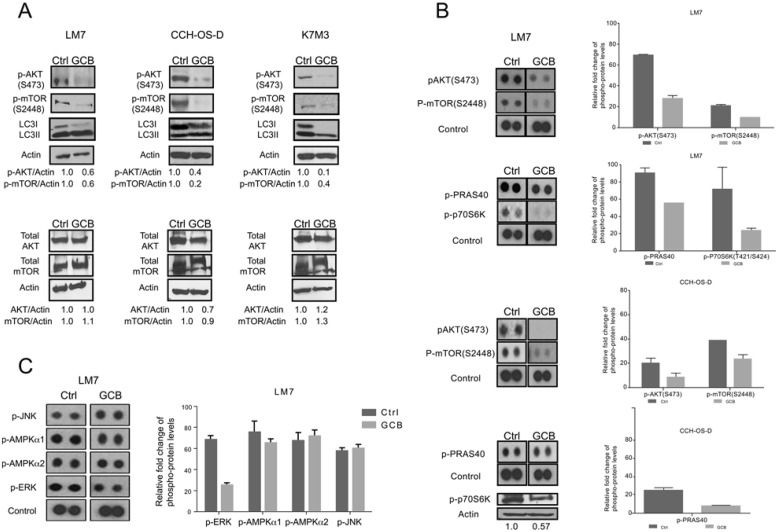
Figure 4. Phosphorylation of AKT and mTOR decreases after treatment with gemcitabine (GCB).
A LM7, CCH-OS-D, and K7M3 osteosarcoma cells were treated with 1μM GCB and cell lysates were analyzed by immunoblotting with specific antibodies for AKT, mTOR, p-AKT, and p-mTOR. β-actin was used as a loading control. Densitometry was performed using ImageJ. B. and C. Following treatment with GCB, lysates were analyzed using the Human Phospho Kinase Antibody Array. The phosphorylation levels of AKT, mTOR, PRAS40, p70S6K, JNK, AMPK, and ERK were evaluated. Densitometry was performed using Image J. Values were graphed as relative fold change. Means ± standard deviation of three independent experiments are shown.

