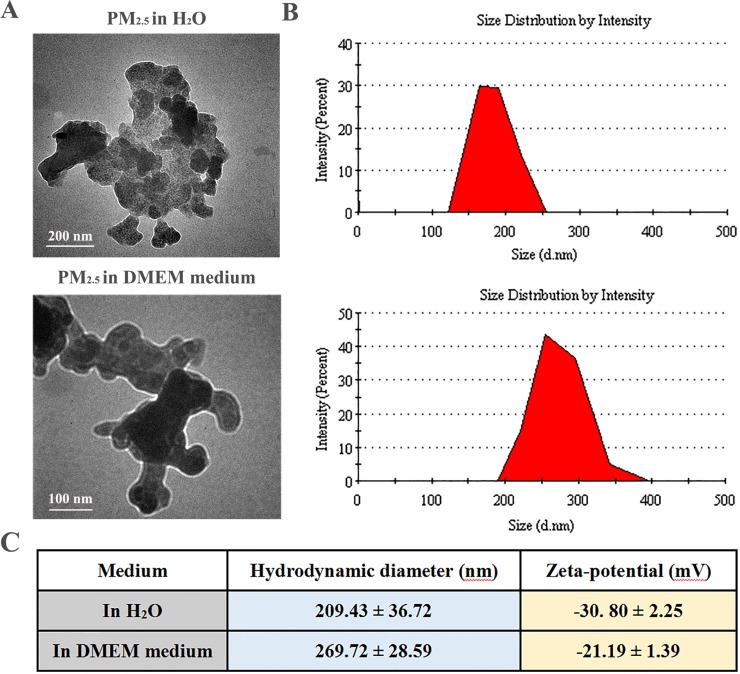
Figure 1. Morphological characterization of PM2.5 samples.
(A) Representative TEM images of PM2.5 in water and cell culture medium (magnification: 150 000× for the upper panel and 200 000× for the lower panel). (B) Gaussian fit curves of PM2.5 size distribution. (C) The hydrodynamic diameter and zeta potential of PM2.5 samples measured in water and cell culture medium at 100 μg/mL (n = 5).

