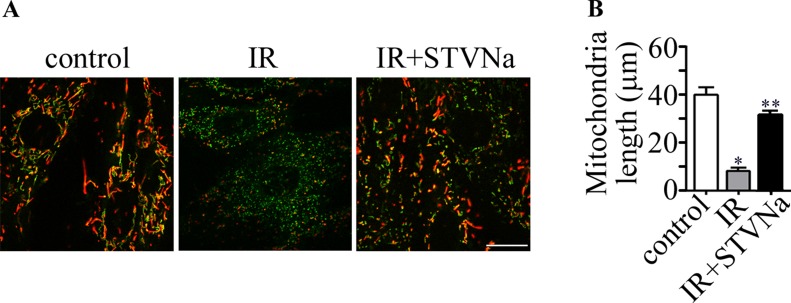
Figure 5. Changes in mitochondrial morphology during IR.
(A) JC-1 staining shows the tubular mitochondrial morphology in H9c2 cells under normal conditions. Small and fragmented mitochondria were evident in cells undergoing IR. STVNa (10 μM) recovered mitochondrial morphology to some extent. Scalebar: 100 μm. (B) Experiments were performed as in (A), and the length of mitochondria were measured. The data were then normalized to the control group. All values are expressed as means ± S.E.M, n = 40 per group *P < 0.05; **P < 0.01.

