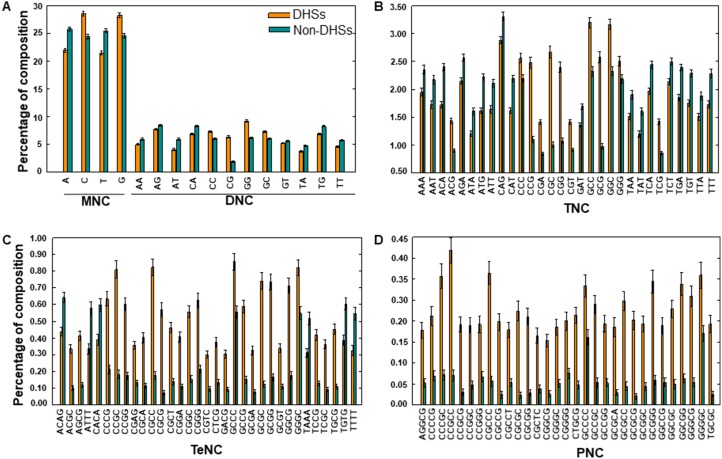
Figure 2. Compositional analysis.
(A) MNC and DNC preferences in DHSs and non-DHSs. TNC, TeNC, and PNC preferences between DHSs and non-DHSs is shown in (B), (C), and (D), respectively. In (B), (C), and (D), only compositions with absolute differences between DHSs and non-DHSs of greater than 0.20 are shown.

