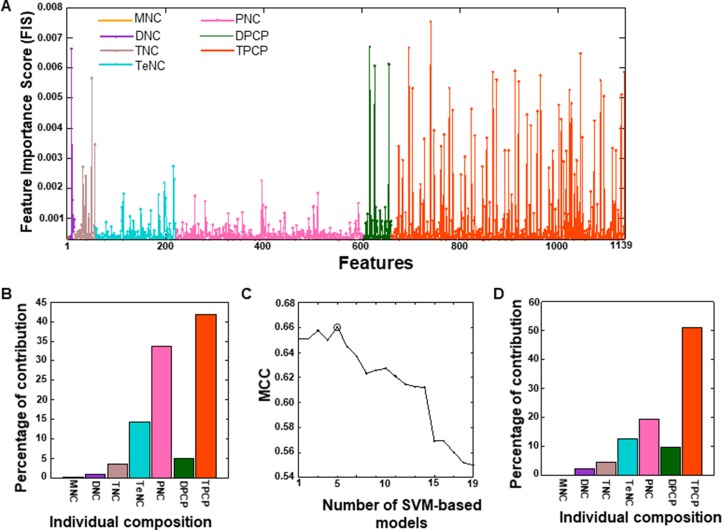
Figure 3.
(A) Optimal feature candidates are shown along with their importance scores. The X- and Y-axes represent the features and their importance scores, respectively. The percentage of individual contributions of the optimal feature candidates is shown in (B). (C) The performance of SVM-based models with respect to 19 different sets of features, which were generated from optimal feature candidates using FIS cut-offs. The final selected SVM-based model is circled, and its feature contribution is shown in (D).

