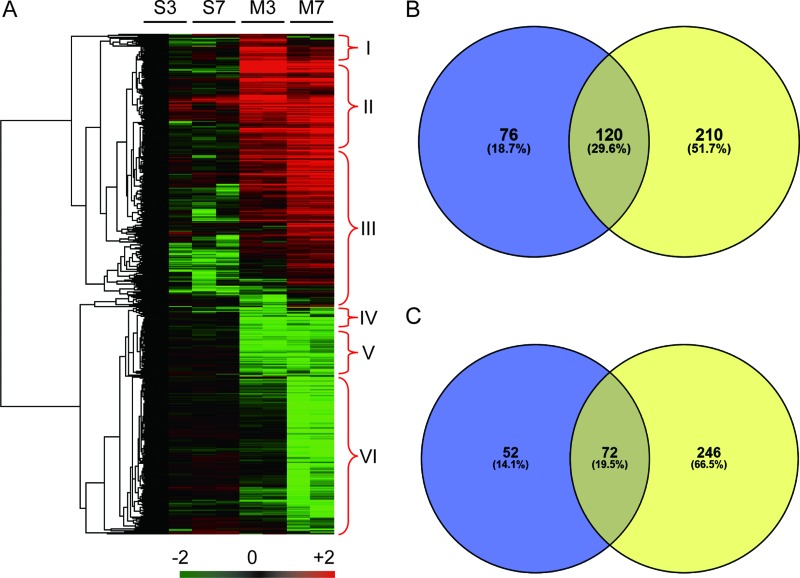
Figure 2. Heat map and Venn diagram of significantly differential abundant proteins.
(A) Heat map of 776 proteins that showed significantly differential accumulation levels in either MI-3d or MI-7d. S3, Sham-3d; S7, Sham-7d; M3, MI-3d; M7, MI-7d. The protein accumulation patterns in cluster I to cluster VI are indicated. (B) Venn diagram of proteins preferentially accumulated in MI-3d (blue) and MI-7d (yellow). (C) Venn diagram of proteins significantly reduced in MI-3d (blue) and MI-7d (yellow).

