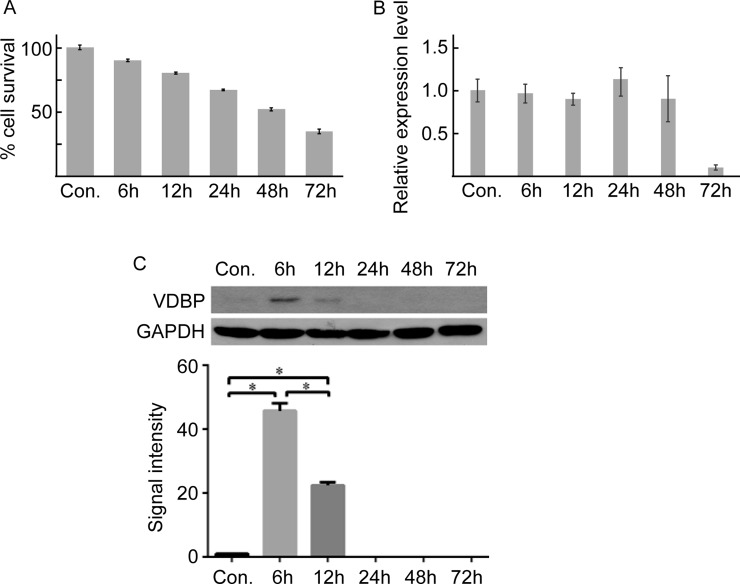
Figure 3. Quantitative PCR and western blot validation of VDBP in OGD/R cultured cells (each group, n = 5).
(A) The cell survival rate at different times in OGD/R-cultured cells determined by MTS. (B) Real-time quantitative PCR of VDBP gene at different times after OGD/R culture. (C) Western blot (upper) and the gray signal intensities (lower) of VDBP for OGD/R-cultured cells at different times.

