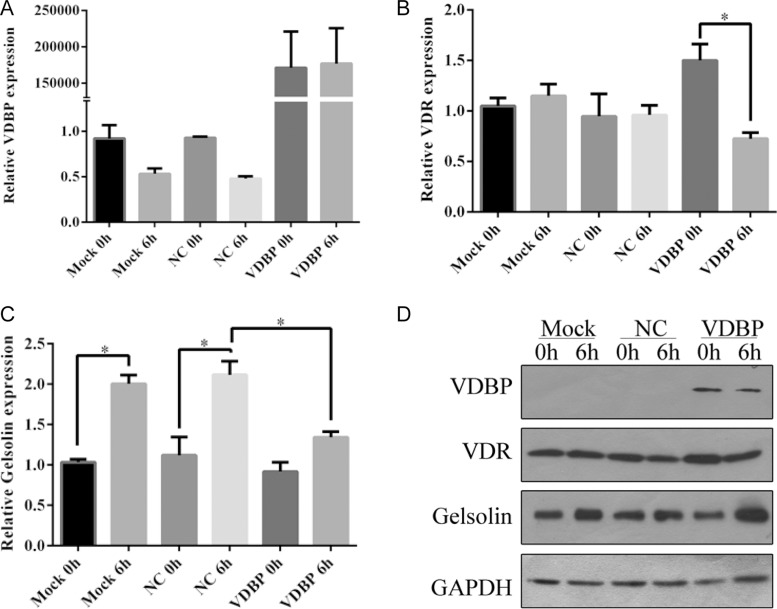
Figure 4. Overexpression of VDBP in H9C2 cells reducing the expression level of vitamin D receptor after OGD/R culture (each group, n = 5).
Relative expression levels of VDBP (A), VDR (B) and GSN (C) were determined by quantitative PCR in H9C2 cells at 0 h and 6 h of OGD/R culture. Mock, standard H9C2 cells; NC, cells transfected with blank vectors as negative control; VDBP, cells transfected with VDBP overexpression vectors. The expression level of each gene in mock 0 h was set at 1. (D) Protein levels of VDBP, VDR and GSN were determined by western blot. GAPDH was used as a control.

