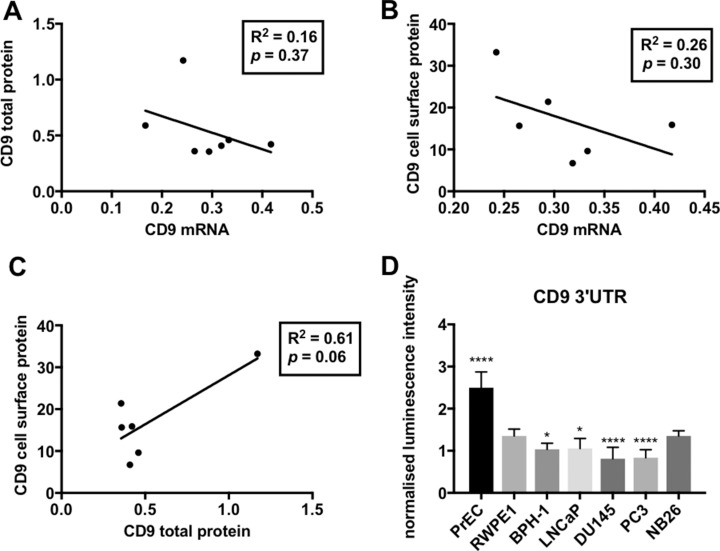
Figure 2. Linear regression analysis of CD9 levels in prostate cell lines.
(A) An inverse trend was found between the geomean of CD9 mRNA levels versus the geomean of CD9 total protein levels (from Figure 1). (B) An inverse trend between the geomean of CD9 mRNA levels compared to geomean of CD9 cell surface levels was observed. (C) A positive trend was seen between the geomean of CD9 total protein levels versus geomean of CD9 cell surface levels (p = 0.06). For all combinations (A, B and C), a linear regression analysis was performed with 95% CI and p < 0.05. All results are shown as arbitrary units. (D) Prostate cancer cell lines (PC3 and DU145) naturally display repressed CD9 3’UTR activity compared to non-tumorigenic prostate cells as assessed using a CD9 3’UTR dual luciferase reporter assay. Renilla luminescence intensity was normalized to a firefly luciferase vector (transfection control) and the 3’UTR empty vector (positive control; n = 3, y-axis shown as arbitrary units; p = 0.01*, p < 0.0001****.

