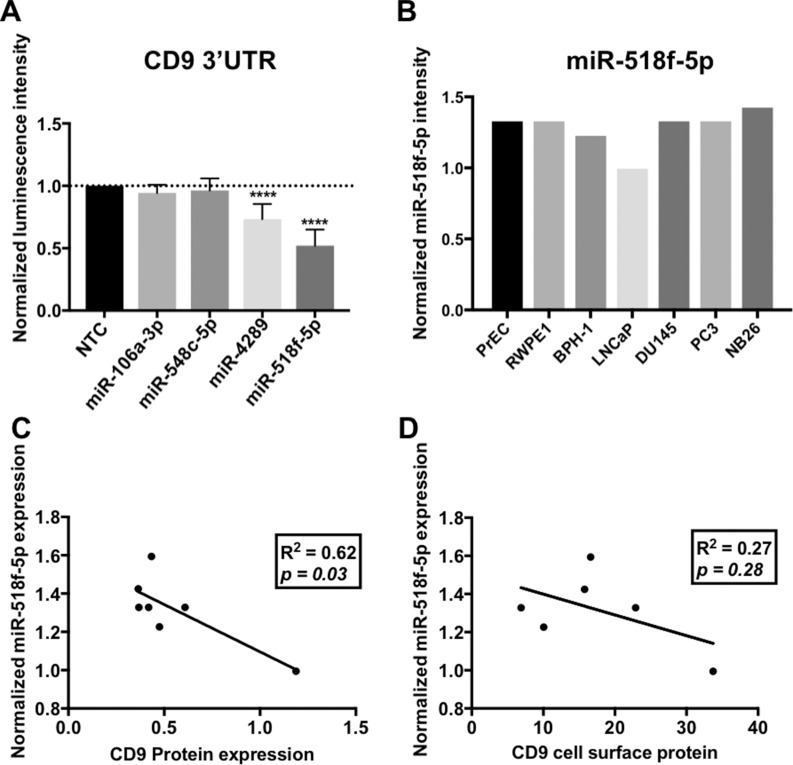
Figure 4. miRNAs predicted to regulate CD9 bind to the CD9 3’UTR in vitro.
(A) Transfection of miR-106a-3p and miR-548c-5p mimics led to no change in CD9 3’UTR activity, however miR-4289 and miR-518f-5p resulted in a significant decrease in CD9 3’UTR activity; n = 3, results expressed in arbitrary units; p < 0.0001****. Results are shown as luminescence intensity normalized to firefly luminescence (transfection control) and expressed as a fold change relative to a miRNA negative control (NTC). (B) miR-518f-5p shows differential expression in prostate cell lines as assessed by miRNA microarrays. Results are shown as normalized intensity values, n = 1. (C and D). Linear regression analysis of miR-518f-5p levels and CD9 total protein (C) and CD9 cell surface levels (D). A significant inverse correlation was found between miR-518f-5p and CD9 total protein levels, however a trend towards a negative correlation was only observed for miR-518f-5p and CD9 cell surface protein levels.

