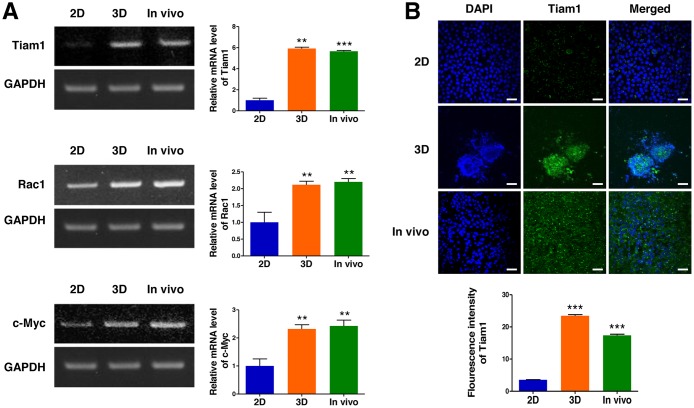
Figure 6. Expression of Tiam1, Rac1, and c-Myc in 2D- and 3D-cultured EL4 cells and their in vivo tumor tissue.
(A) RT-PCR demonstrates upregulated expression of Tiam1, Rac1, and c-Myc genes in 3D spheroids compared to 2D culture. EL4 cells expressed higher levels of Tiam1 in the 3D culture and fresh EL4 tumor than in the 2D culture, with no significant difference in the expression level of Tiam1/Rac1 between the 3D culture and fresh in vivo tumor. Bar graphs depict densitometry quantitation of Tiam1, Rac1, and c-Myc mRNA expression normalized to GAPDH mRNA. (B) Immunofluorescence images also show that EL4 cells expressed higher levels of Tiam1 in the 3D culture and fresh EL4 tumor than in 2D culture. The Tiam1 staining intensities were measured using ImageJ software. Data represent the means ± SD of three independent experiments. Scale bar, 40 μm. *P < 0.05, **P < 0.01, and ***P < 0.001 versus the control.

