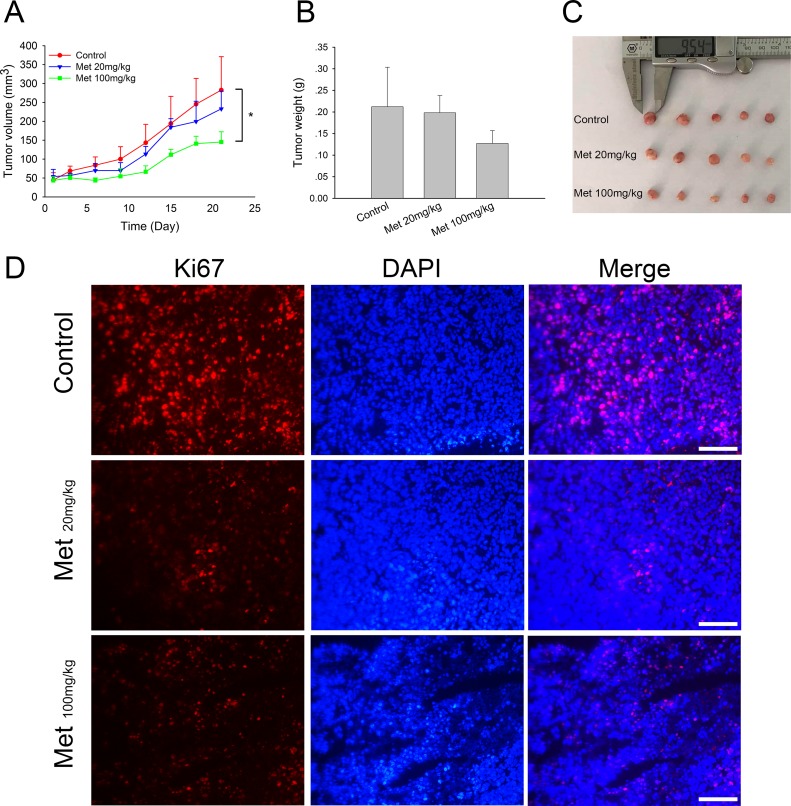
Figure 4. In vivo effect of metformin on MCF7/ADR xenografts.
(A) Tumor volume during metformin treatments. (B, C) The overall view and weight of the isolated MCF7/ADR tumors in the end of the treatments. Mice receiving intratumoral injection of physiological saline were regarded as control group. (*P < 0.05, compared with control group). (D) Immunofluorescence staining of Ki67 in MCF7/ADR tumor tissues. Bar = 100 μm.

