Figure 3.
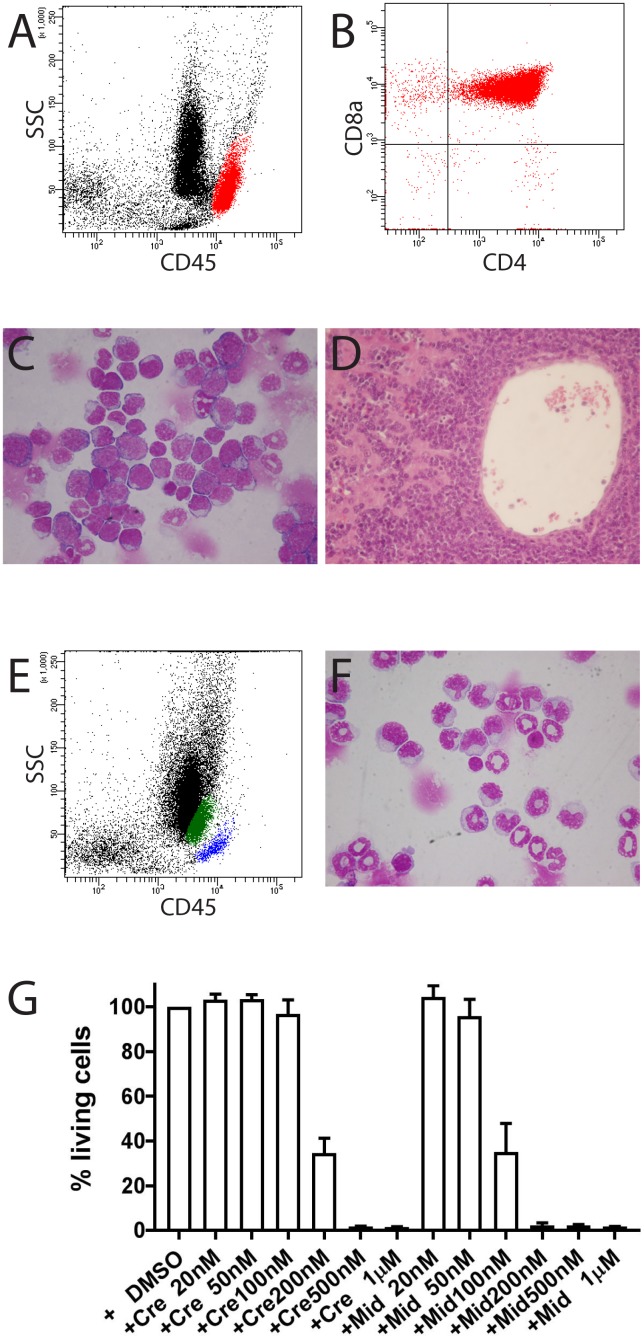
Development of T-ALL in mouse FLT3#457 (FLT3 ITD/ITD) (A-D). (A) Location of T-lymphoblasts (red population) from bone marrow in the aBG (CD45bright) with expression of CD4 and CD8a (B). (C) Bone marrow cytospin showing infiltration of blasts. (D) Liver section showing strong infiltration of blasts. (E, F) CMML in mouse #1382. (E) Flow cytometric analysis showing increased monocytes in bone marrow (green population). Blue population: T and B lymphocytes. (F) Bone marrow cytospin confirming increased monocytes in bone marrow. (G) Leukemic cells from mouse FLT3#457 were sensitive to treatment with FLT3 inhibitors crenolanib and midostaurin. Results are presented as the average percentage of living cells in the presence of inhibitors (100% value derived from DMSO control). Representative results presented are the mean ± SD (error bars) of three independent experiments. Similar results were also observed with leukemic cells from mouse #1361. Cre = crenolanib; Mid = midostaurin.

