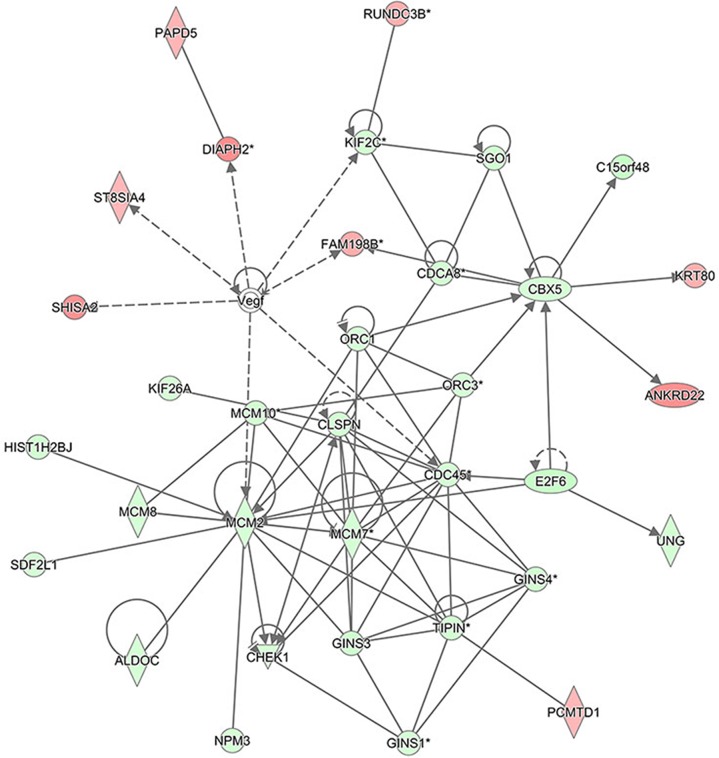
Figure 11. The interaction network analysis.
The interaction network illustrates the interrelationships among the molecules with concentrated data. This network mainly affects DNA replication, recombination, and repair, cell cycle, and embryonic development. In this network, the molecules in red represent the up-regulated expression while in green represent the down-regulated expression. The solid lines represent the direct interactions, the dotted lines represent the indirect interactions, the solid lines with arrow represent the direct activation.

