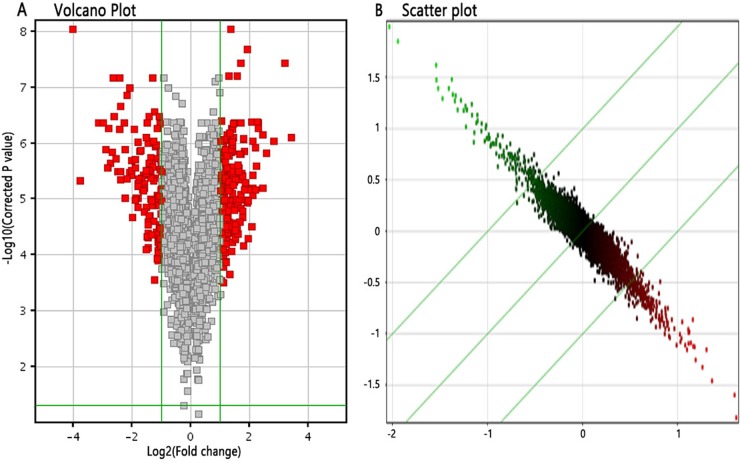
Figure 2. Differentially expressed genes between 4-OH-TAM-treated group and NC groups.
(A) Volcano Plot, which demonstrated the distribution of the differentially expressed genes between TAM-treated group and control group. The X-axis represents the logarithm conversion of the fold difference to base 2 and the Y-axis represents the logarithm conversion of the corrected significant levels to base 10. The red color represents all the probes with fold difference >1.5 at significant level of P<0.05. (B) Scatter plot, which exhibited the distribution of the signals between TAM-treated group and control group in Cartesian coordinate plane. The X-axis represents TAM-treated group, and the Y-axis represents the control group. The ordinate value and the abscissa of each spot represent the expression values of one probe in TAM-treated group and control group. The parts above the green lines represent the down-regulated probes in relative to the control group. The parts underneath the green lines represent the up-regulated probes as compared to those of the control group.

