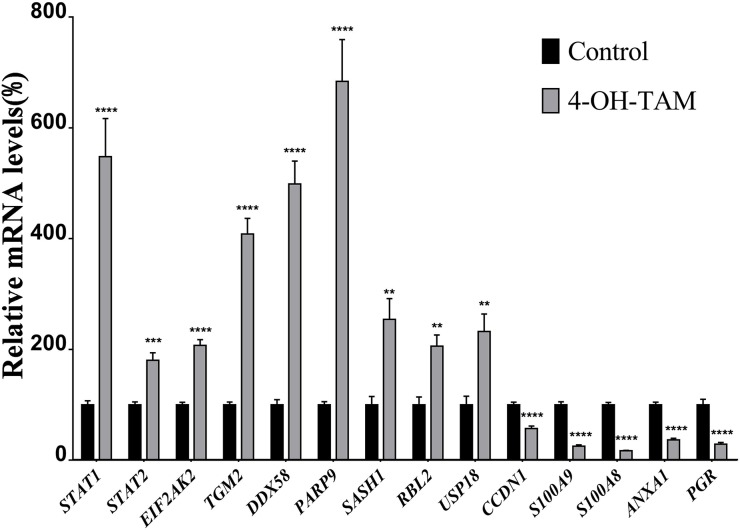
Figure 3. Relative mRNA levels of up-regulated and down-regulated genes induced by 4-OH-TAM treatment in MCF-7 cells.
MCF-7 cells were treated with or without 4-OH-TAM at 1.0×10⁻⁷M for 72 h before cells collection. Total RNA samples were isolated from 4-OH-TAM treated and NC groups and qRT-PCR analyses were performed as described in Materials and Method section. Data are presented as means ± SD. *P <0.05, **P <0.01, ***P <0.001 ****P <0.0001 vs. controls (n=7).

