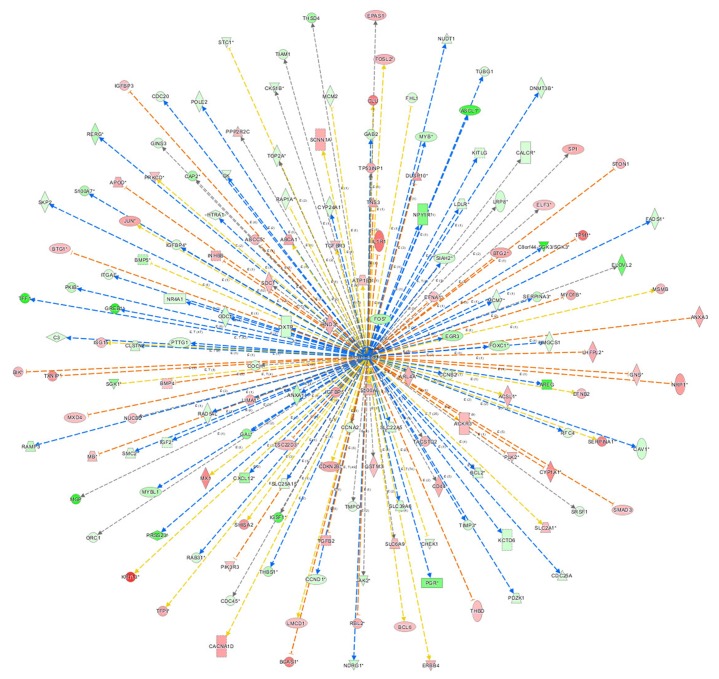
Figure 7. The network of β-estradiol.
The network of β-estradiol showed the network of predicted upstream regulatory factor, β-estradiol and down-stream molecules in the data set. The orange lines indicate the activating expression status between the upstream regulatory factors and the downstream genes; blue lines indicate the inhibitory expression status between the upstream regulatory factors and down-stream genes; the grey lines indicate that there is no prediction information related to the expression status in the data.

