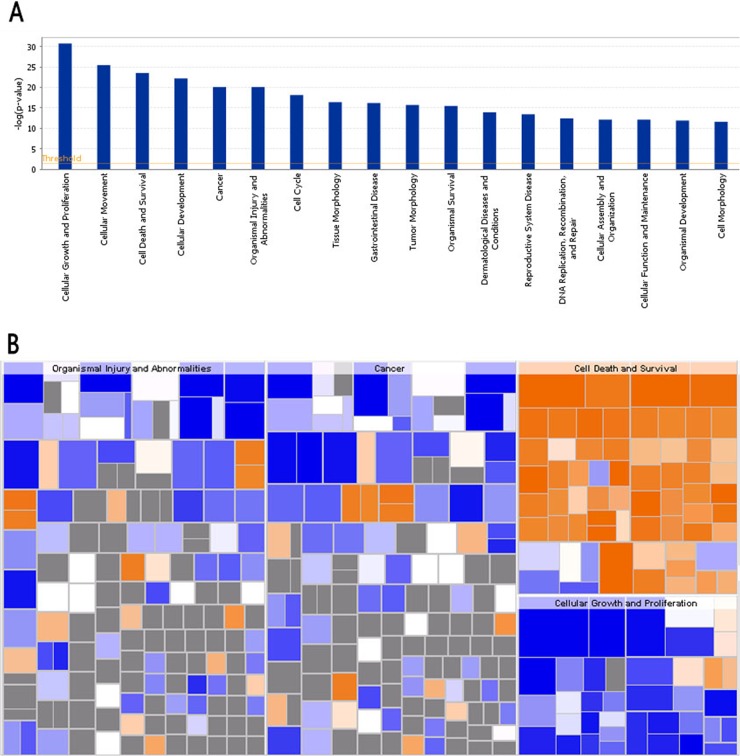
Figure 8. Bio-informatics analysis of the disease and function.
(A) The disease and function bar figure illustrate the cluster status of the differential genes in categories of disease and functions. All the diseases and functions were ranked by using –Log (P-value). (B) Disease and Function Heat Map illustrates the relationships between up-regulation and down regulation of the differentially expressed genes and the activation and inhibition of functions and diseases. The orange color indicates Z-score>0, blue color indicates Z-score<0, grey color indicates Z-score value. Z-score>2 indicates that function is strongly activated; Z-score<-2 indicates that that function is strongly inhibited. In this study, the functions that are strongly activated include: apoptosis of cervical cancer cell lines (3.597 folds), cell death of cervical cancer cell lines (3.268 folds) and the functions that were significantly inhibited include: proliferation of cancer cells (-3.510 folds), and proliferation of cells (-3.239 folds).

