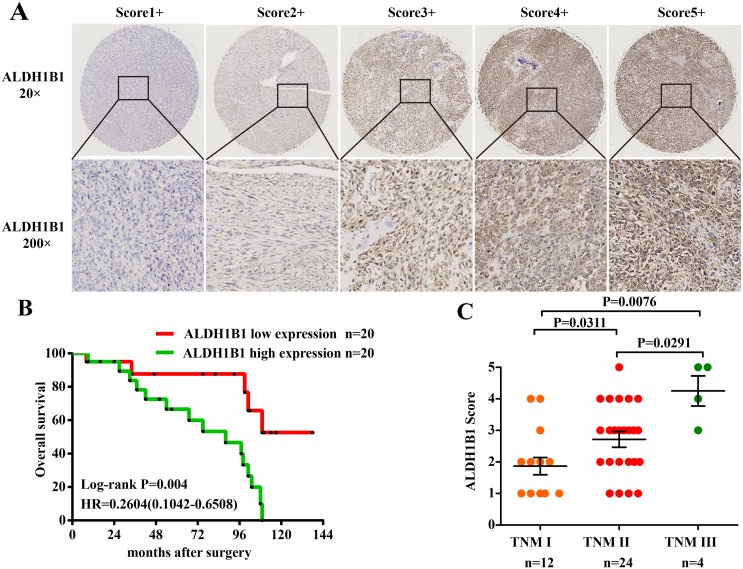
Figure 1. Association of ALDH1B1 expression and clinical significance in our OS patients.
(A) Representative images of different immunohistochemical staining intensities of ALDH1B1 are shown in OS tissues. The percentage of cells showing positive staining was calculated by reviewing the entire spot. On the basis of the percentage, the staining patterns were categorized into 5 groups: 1, 1+, positive cells <10%; 2, 2+, positive cells 10% to 25%; 3, 3+, positive cells 26% to 50%; 4, 4+, positive cells 51% to 75%; and 5, 5+, positive cells >75%. (Original magnification, ×400). (B) Kaplan-Meier analysis was used to analyzed the overall survival of OS patients with low ALDH1B1 expression (score 1+, 2+ and 3+) and high ALDH1B1 expression (score 4+ and 5+). (C) Distribution of ALDH1B1 staining scores among the patients with TNM I, II and III stages.

