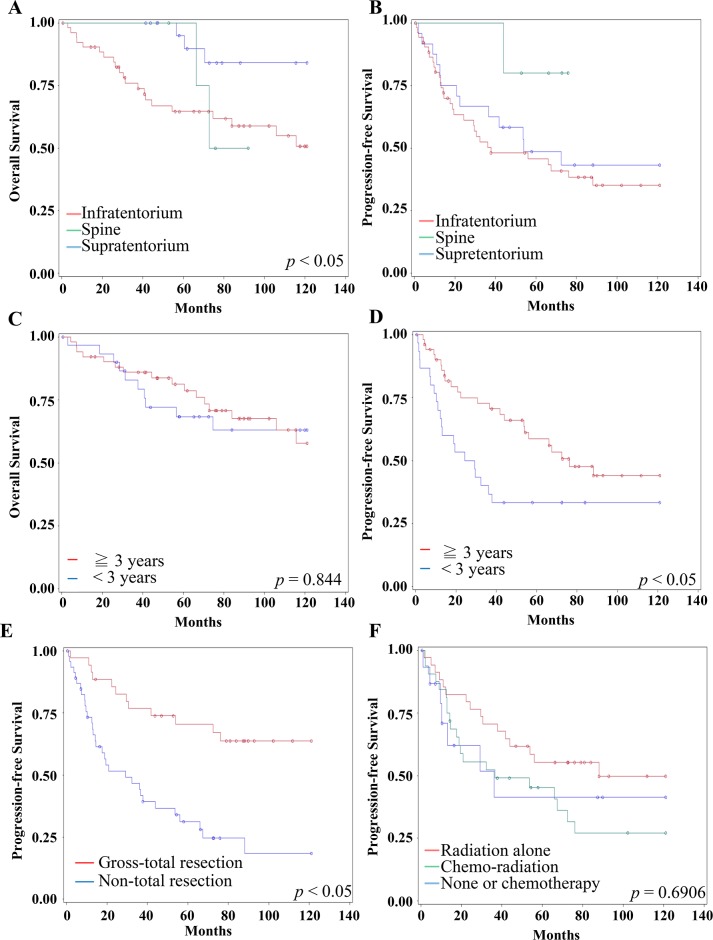
Figure 1. Clinical factors for Survival and Progression.
(A-B) The 10 years overall survival (A) and progression-free-survival (B) of different locations were distinct. Red line represents infratentorium. Green line represents spine. Blue line represents supratentorium. (C) The 10 years overall survival for more than or equal to 3 vs. less than 3-year-old patients were no significant (P=0.844). Red line represents equal or more than 3-year-old. Blue line represents less than 3-year-old. (D) The age less than 3-year-old was significantly related to worse 10 years progression-free survival (P=0.040). Red line represents equal or more than 3-year-old. Blue line represents less than 3-year-old. (E) The gross total resection was significantly related to a longer 10 years progression-free survival (P=0.003). Red line represents gross-total resection. Blue line represents non-total resection. (F) There is no significant difference of 10 years progression-free survival among adjuvant treatment by using Kaplan Meier method (p=0.63). Red line represents adjuvant radiation alone (N=41). Green line represents adjuvant chemo-radiation (N=39). Blue line represents none or chemotherapy alone (N=20).

