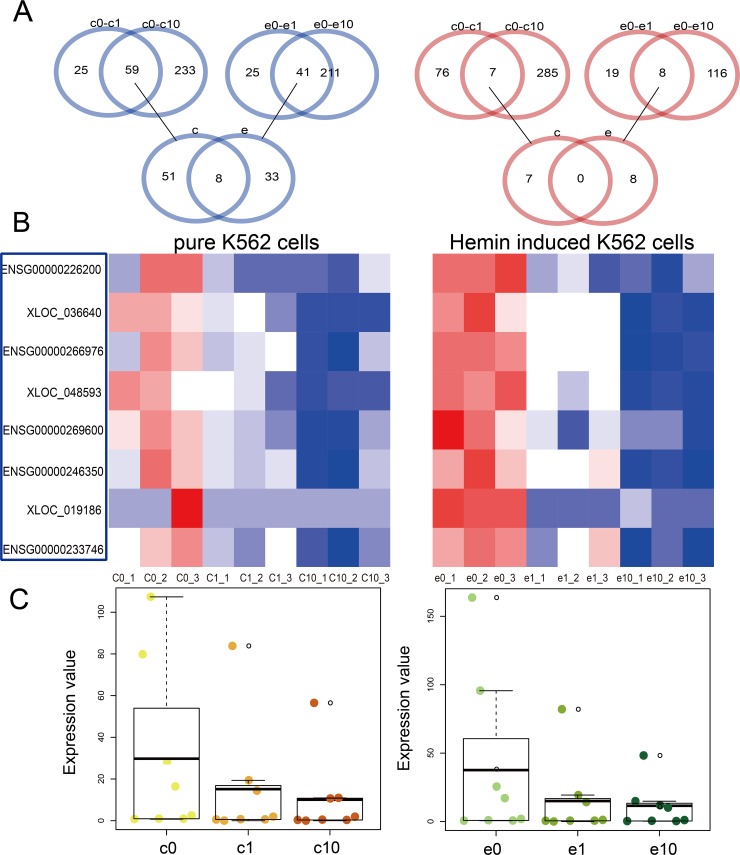
Figure 2. Dysregulated lncRNAs in pure and hemin-induced K562 cells.
Venn diagrams showing differentially expressed lncRNAs shared among four groups, including pure K562 cells and those treated with 1 uM DHA (c0-c1), pure K562 cells and those treated with 10 uM DHA (c0-c10), hemin-induced K562 cells and those treated with 1 uM DHA (e0-e1), and hemin-induced K562 cells and those treated with 10 uM DHA (e0-e10) (A) Heat maps of dysregulated lncRNAs in pure and hemin-induced K562 cells (B) Red and blue colors in (A) and (B) represent upregulated and downregulated lncRNAs, respectively. Boxplots showing differentially expressed lncRNAs (C) Darker color represents treatment with higher DHA concentrations. Yellow and green represent pure and hemin-induced K562 cells, respectively.

