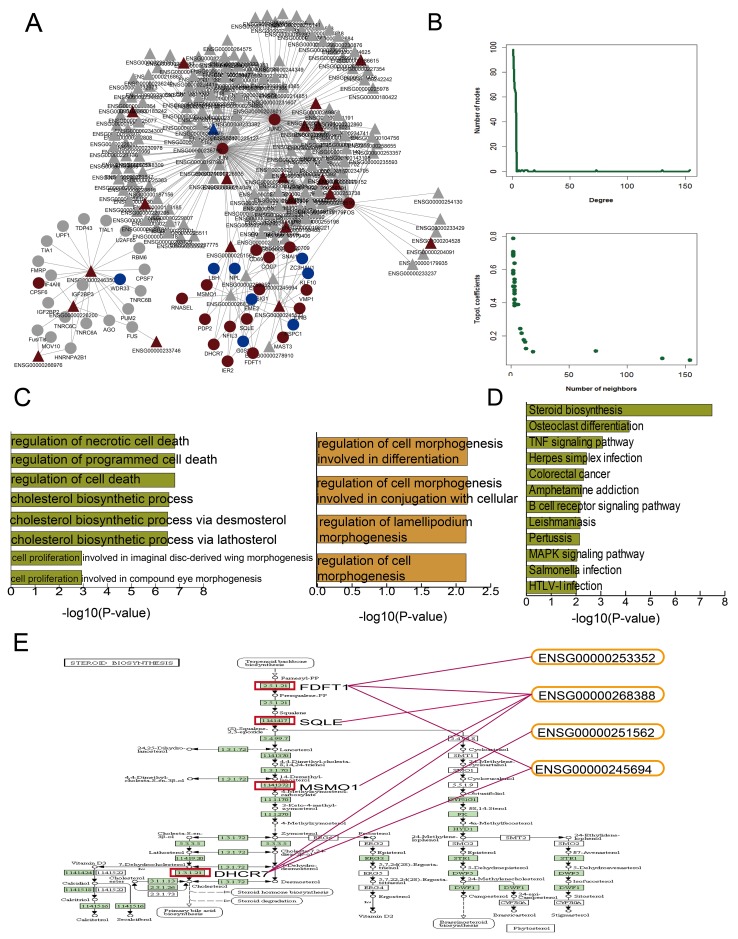
Figure 3. DHA-related mRNA-lncRNA network and functional analysis.
DHA related mRNA-lncRNA regulation network (A) Nodes represent candidate DHA targets in K562 cells. Circular and triangle nodes represent mRNAs and lncRNAs, respectively. Red and blue colors represent up- and downregulation, respectively. Basic network features, including degree and topological coefficients (B) Pathways enriched for differential mRNAs (C) and GO terms enriched for differential mRNAs (green) and lncRNAs (yellow) (D) are ranked by -log10(P) and shown as bar plots. The steroid biosynthesis pathway shows four key dysregulated mRNAs (red rectangles) regulated by four dysregulated lncRNAs (E).

