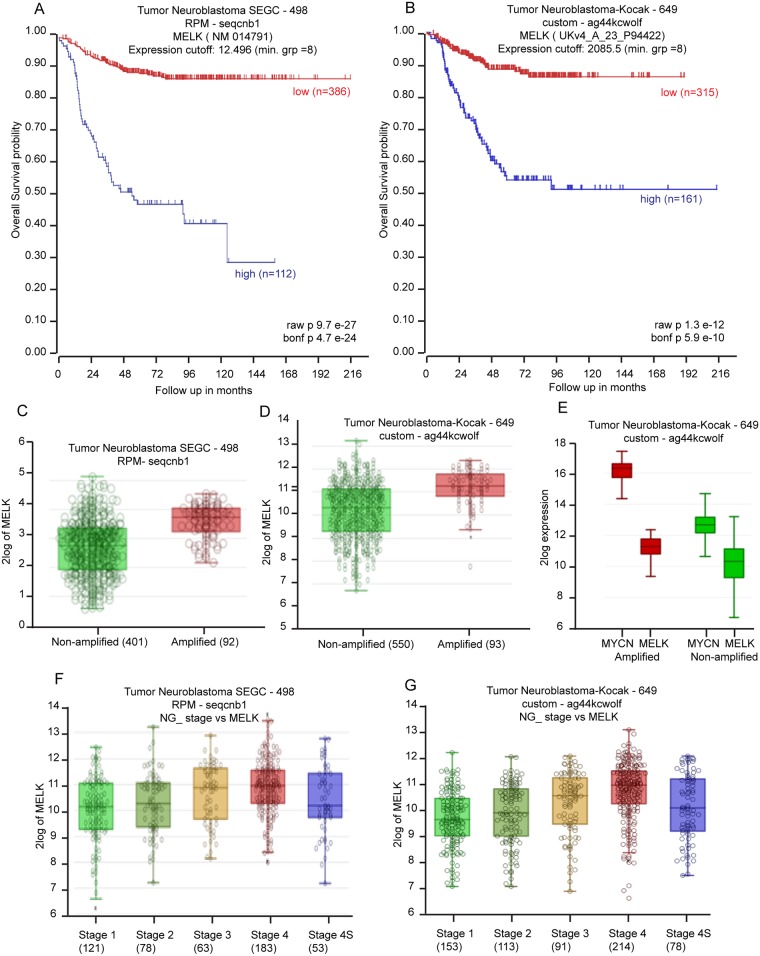
Figure 1. MELK is a prognostic indicator in NB.
(A and B) Kaplan-Meier curves show the probability of overall survival based on MELK expression level of 498 patients in the SEGC dataset (A) and 649 patients in the Kocak dataset (B). (C and D) R2-tumor neuroblastoma SEGC dataset (C) and Kocak dataset (D) show higher MELK expression level in MYCN-amplified cases in comparison to MYCN-non-amplified cases. (E) The Kocak dataset shows significant correlations of MELK with MYCN expression levels. (F and G) R2-tumor neuroblastoma SEGC dataset (F) and Kocak dataset (G) show correlation of MELK expression level with NB disease stages.

