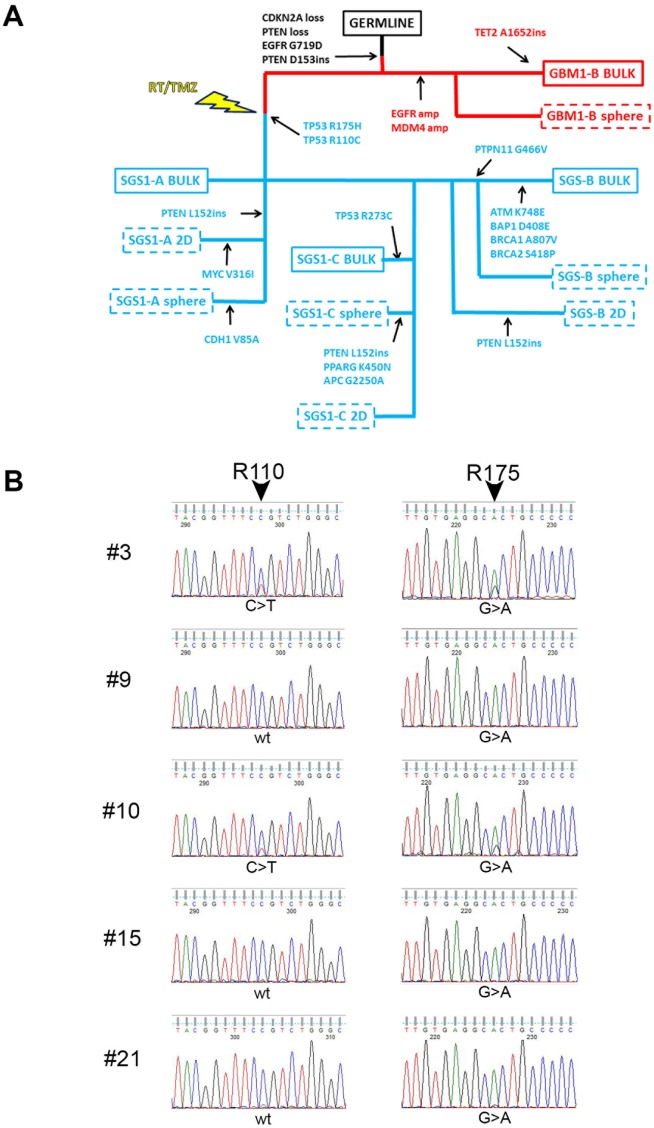
Figure 2. Targeted DNA sequencing reveals relationship between GBM1 and SGS1.
(A) SNVs common and private to each of the bulk specimens and derived cultures obtained from GBM1 and SGS1 were used to construct a phylogenetic tree. GBM1 specimens are denoted in red and SGS1 specimens are denoted in blue. Dashed boxes indicate cultured specimens from bulk tissues, which are denoted by solid boxes. (B) Sanger chromatograms of five single cell-derived colonies from SGS1 sector B sequenced at TP53 exons 4 (left) and 5 (right). Colonies 9, 15 and 21 exhibit the R175H (CGC>CAC) but not the R110C (CCG>CTG) mutation.

