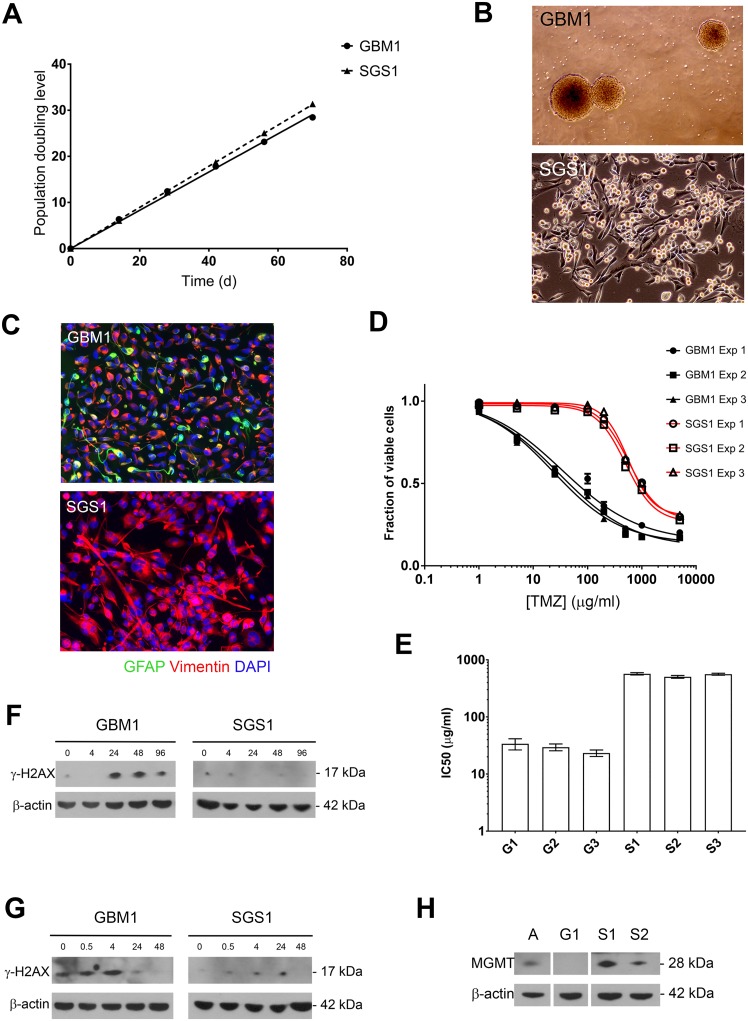
Figure 3. Growth rate and chemoresistance of GBM1 and SGS1 gliomaspheres.
(A) Gliomasphere cultures were serially passaged and cumulative PDL was plotted against time. (B) Phase contrast micrographs at 4x (top) and 10x (bottom) magnification. (C) Neurofilament expression by immunofluorescence (20x). Normalized cell viability (D) and interpolated TMZ IC50 values (E) from three independent experiments comparing GBM1 and SGS1 gliomaspheres. Expression of γH2AX and β-actin control in gliomaspheres by immunoblot at the indicated number of hours after exposure to TMZ 10 μg/ml for 24 hours (F) or 2 Gy ionizing radiation (G). (H) Immunoblot for MGMT expression in gliomaspheres. A=cultured normal human astrocytes, G1=GBM1, S1=SGS1, S2=SGS2.

