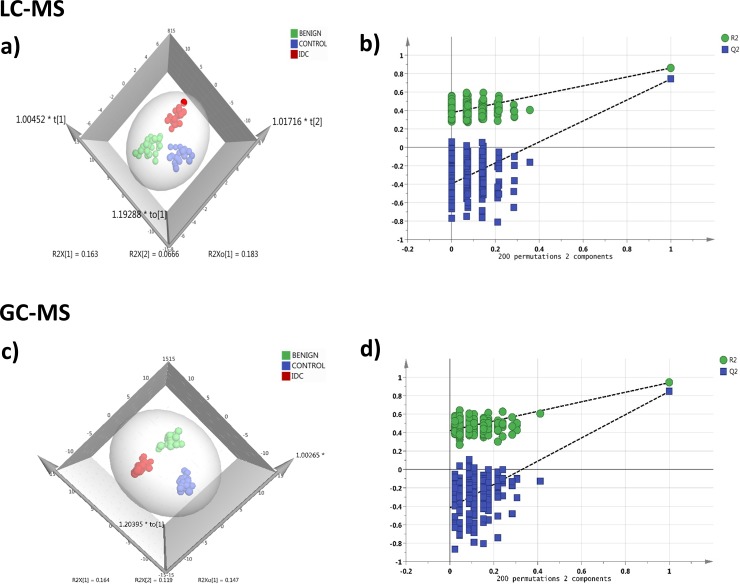
Figure 2. Tissue metabolomics multivariate analysis.
LC-MRM/MS: (a) OPLS-DA score plot of tissue LC-MRM/MS data from IDC subjects (n = 24, red), benign breast patients (n = 24, green) and healthy controls (n = 24, blue), (b) plot obtained after performing a random permutation test with 200 permutations on OPLS-DA model (R2Y = 0.86, Q2 = 0.77), R2 is the explained variance, and Q2 is the predictive ability of the model. Low value of R2Y and Q2-intercepts at 0.36 and -0.45 depicts the high predictability of the model, GC-MS: (c) OPLS-DA score plot of tissue GC-MS data for IDC subjects (n = 24, red), benign breast patients (n = 24, green) and healthy controls (n = 24, blue), (d) plot obtained after performing a random permutation test with 200 permutations on OPLS-DA model (R2Y = 0.94, Q2 = 0.88).

