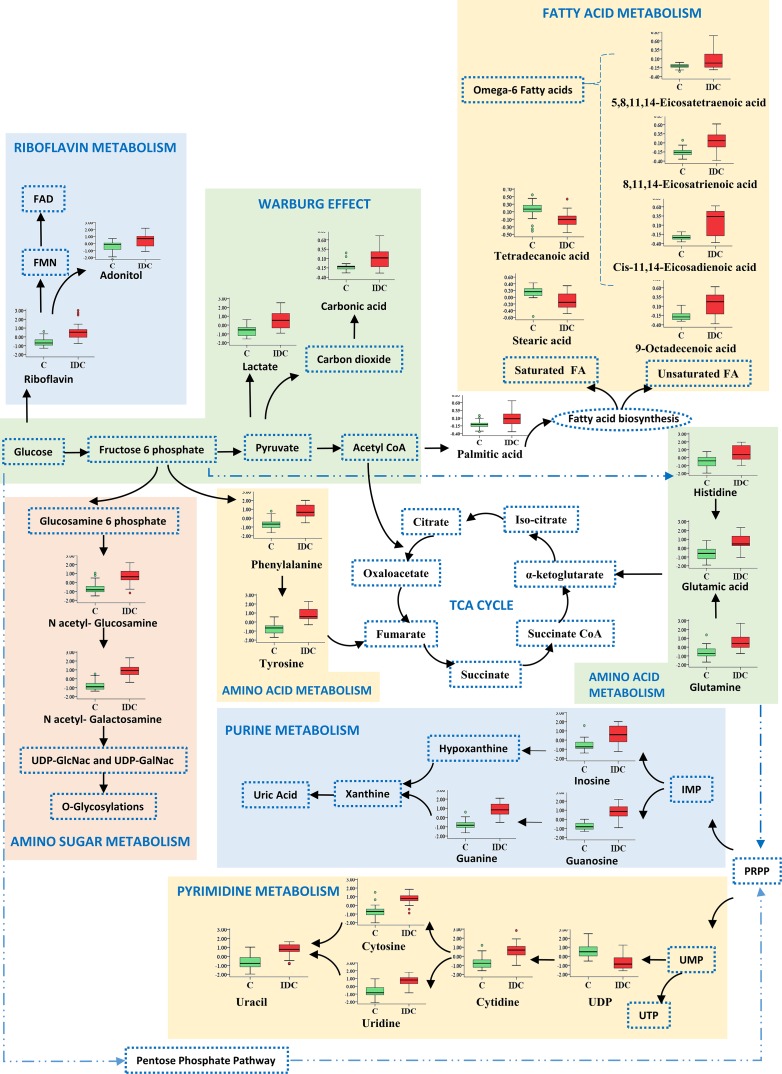
Figure 4. Metabolic pathway network map of significantly altered metabolites from IDC against control analysis in tissue samples.
Metabolites identified in this study are shown along with a box plot illustrating normalized concentration differences of metabolite in IDC tissue (red box) and control (green box). While, metabolites not identified in this study are represented with a dotted blue lines.

