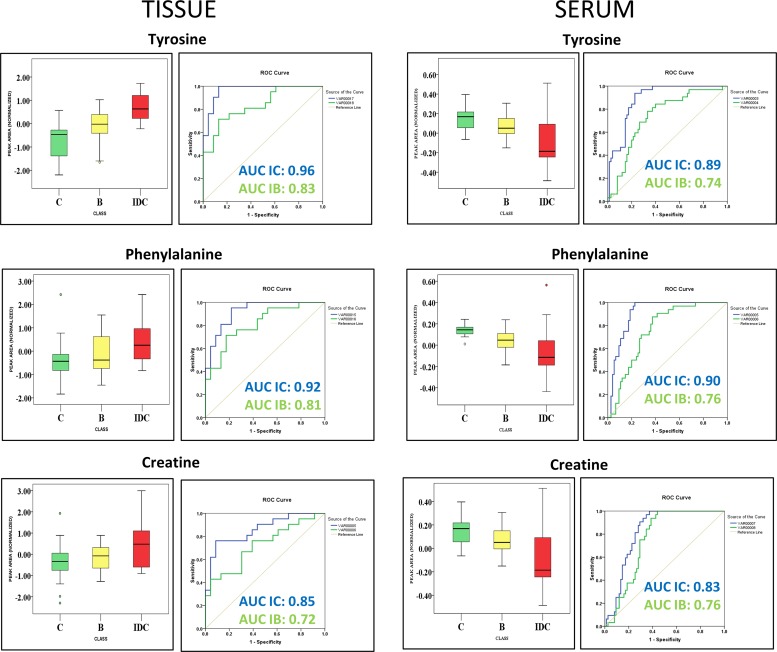
Figure 6. Common metabolites identified in tissue and serum discriminating IDC samples from both benign samples and healthy controls.
Box-and-whisker plots illustrating normalized concentration differences between control (C-green box), Benign (B-yellow box) and Invasive ductal carcinoma (IDC-red box) along with ROC curve analysis plot of sensitivity versus specificity for the three metabolites predicting IDC samples against control (IC-blue line) and IDC samples against benign samples (IB-green line). The plot depicts higher discriminative ability of these metabolites for IDC samples than benign samples.

