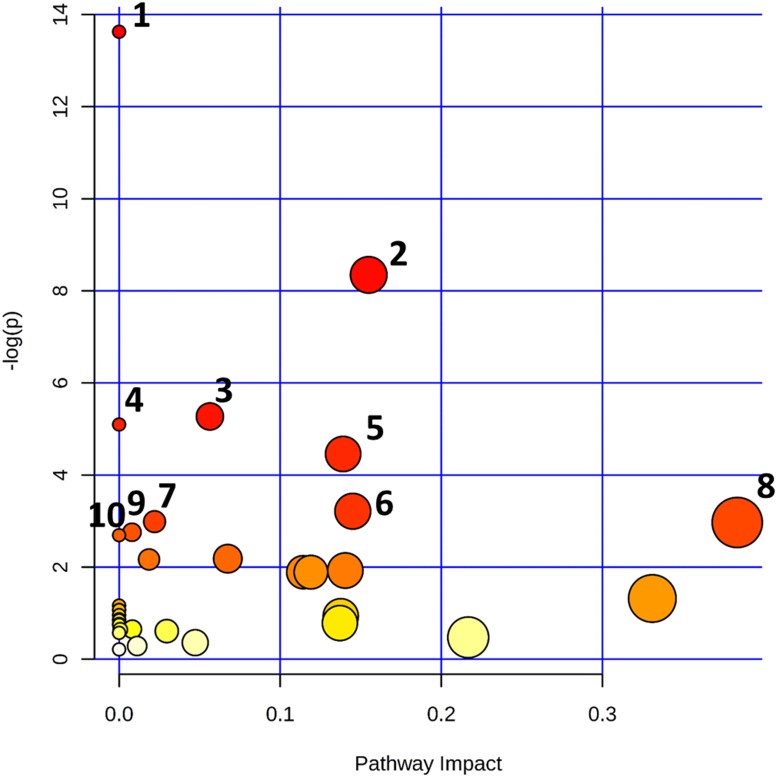
Figure 7. Altered metabolomic pathways observed in tissue of IDC.
Topology map of differentially expressed metabolites generated using metaboanalyst describing the impact of metabolites identified through comparative analysis of IDC against control. Top pathways identified in tissue are 1. Nitrogen metabolism, 2. Pyrimidine metabolism, 3. Aminoacyl-tRNA biosynthesis, 4. Fatty acid biosynthesis, 5. D-Glutamine and D-glutamate metabolism, 6. Riboflavin metabolism, 7. Purine metabolism, 8. Alanine, aspartate and glutamate metabolism, 9. Phenylalanine, tyrosine and tryptophan biosynthesis, 10. Beta-Alanine metabolism.

