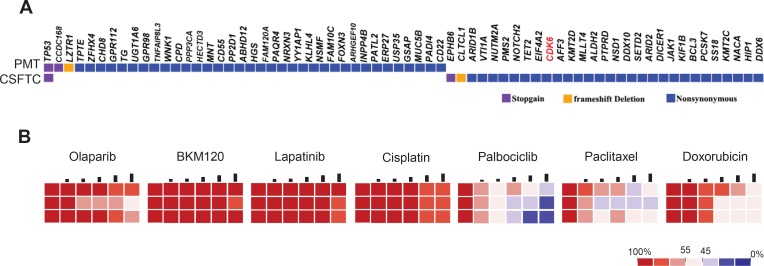
Figure 4. Drug sensitivity on CSFTCs as a potential predictive tool for treatment response.
(A) The distribution of somatic mutations detected by exome sequencing was presented in a heat map. (B) Heatmaps represent cell viability after treatment of selected anticancer drugs. Each concentration represents a 2-fold increase from the previous dose, with each concentration tested in triplicate.

